

| Using Revolve | Using Annotations | |
In this session, you look at Revolve's impact analysis capabilities. First you assess an impact manually, then you trace further impacts using the automatic impact analysis feature.
Please see the Tutorials Map to check that you have run all necessary previous sessions.
When you edit source code your changes might impact other components besides the ones you edited. You use the Impact Analysis tool to identify where these impacts are so you can fix them before they create difficulties.
In this session, you first use the Browsers menu to find an item of interest. You then use the code navigation facilities of Revolve to manually follow logical connections defined in the source code to analyze impacts, or have Revolve automatically determine the impact of changing the item. A step-by-step example of both Manual Impact Tracing and Automatic Impact Tracing are provided in this session.
This session uses the project you created in the chapter Using Revolve.
To trace impacts manually:
This searches the source code for the literal "a". The search result is displayed in the window, and the edit bar indicates that one match has been found.
This button toggles the Split Screen Editor on and off. The window is horizontally split and the source code for the selected item is selected in the bottom window. You can edit source code here if you wish.
Notice that each time the selection in the top window changes, the corresponding source code is displayed in the Split Screen Editor.
The A on the line that begins IF ONL0006-ACTION-LOAD-I = ("A"... is selected in the Split Screen Editor.
In this way, you can quickly get to all the places in the application that use the constant A. These locations can be used as starting points for impact analysis.
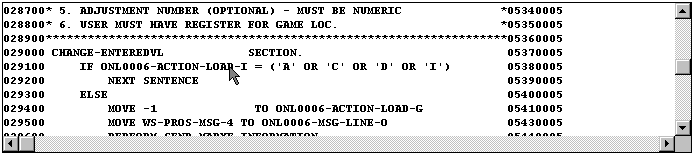
Figure 5-1: Selecting in the Split Screen Editor
This scrolls the Split Screen Editor to the working-storage definition of the selected item.
The group item ONL0006I is selected.
The code navigation features of the Split Screen Editor enable you to quickly examine the source code and find where the value of ONL0006-ACTION-LOAD-I is set. This is critical information because this data item was found through its relationship to the literal A, which was the start of our analysis. Should changes be made to A, ONL0006-ACTION-LOAD-I will be affected.
The Execution Simulator toolbar appears in the window. Using this, you can simulate execution of the code either forward or backward so that the logical paths through the source code can be traced to determine impacts.
Since the statement being executed is a CICS RECEIVE, the appropriate Screen view is displayed. Also the Execution Condition dialog is displayed to affirm the conditional statement.
Since the literal A was an action code, it is not surprising that the screen has an "ACTION:" heading followed by a one-byte entry field. In fact, this is the field that is impacted by the literal that you used to begin this analysis.
A faster, more accurate approach is to have Revolve automatically determine the areas impacted by changing an item. This session illustrates Automatic Impact Tracing by determining the impact of changing the variable TREND-KEY which is used to access the VSAM file PROD.TREND.MASTER.
The Data Files browser is displayed.
The folder PROD.TREND.MASTER is displayed in the information window.
The folder is expanded and all the source files that reference the data file are displayed.
Line 100: cics_state_read
The source code appears in the Split Screen Editor.
The selection is positioned to a CICS READ of the dataset TRENDMS. This CICS dataset is an alias for the dataset PROD.TREND.MASTER. The alias is established in the ONLINE.FCT file that is also displayed in the information window.
The Impact Analysis tool is invoked displaying TREND-KEY.
The Tracing Group Impacts dialog shows the progress of the trace.
By default, Impact Analysis displays results by name. In the section Manual Impact Tracing, you traced an impact to a screen. Here Revolve has traced it for you. Let's see how the impacts for TREND-KEY affect BMS screens in the project.
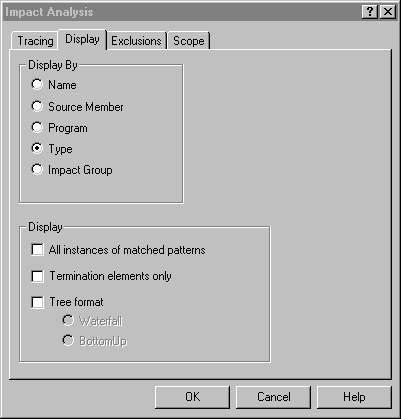
Figure 5-2: Display Tab
The results are now displayed according to their impact types.
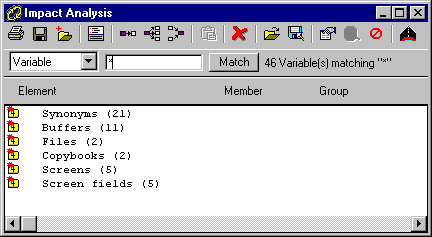
Figure 5-3: Impacts Displayed by Type
Impacted screens, buffers, and synonyms are automatically traced and provided for your reference.
The folder opens to display the impacted screens.
The Screen view for PP3.BMS is displayed in the lower window.
The traced chain of events that led to the impact is displayed. Each line of text that is displayed explains the movement of the screen to its impact with TREND-KEY. As you move down the trace, observe the corresponding code in the Split Screen Editor.
In this session you:
If you want to take a break before going on to the next session, you can close the project; or you can close Revolve, with or without closing the project.
Return to the Tutorials Map and choose which session to go on to next.
Comments on the books?
Click Send Us Comments.
Copyright © 2000 MERANT International Limited. All rights reserved.
This document and the proprietary marks and names
used herein are protected by international law.
| Using Revolve | Using Annotations | |