

| The Worksheet and Group Working | Using Revolve | |
This chapter describes the reports you can produce on the information in your local worksheet.
You can generate reports from your local worksheet by clicking
 Reports. You can
then choose from the following:
Reports. You can
then choose from the following:
This provides an instant report using either an HTML browser or a text viewer.
This provides a text database, which you can use when writing your own reporting programs.
This provides a Microsoft Access database which includes a selection of standard reports. You can modify these or create your own, tailored reports. Alternatively, you can export any Access report, queryview or table in several formats to process further, as you wish.
This provides an instant component summary of currency data items and statements, using either an HTML browser or a text viewer.
This reports on all file-based data items used in the project, giving source locations for each use and definition, using either an HTML browser or a text viewer.
If you choose to output a report in HTML form, you need to have a suitable browser installed. The browser needs to be able to handle frames. Examples are Internet Explorer V3.0 and Navigator V3.0. The default browser provided with Windows NT V4.0 is unsuitable.
You can produce a detailed report of the points of interest in the
worksheet, by component, by clicking
Reports and selecting Worksheet Status Report. You can
then specify several options for the report on the dialog shown in Figure
10-1. For help on these options, click the  in the top right corner of the dialog and click the item you want help on.
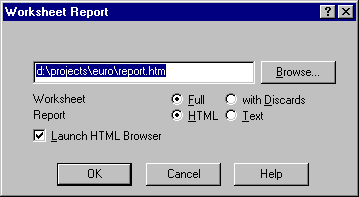
Figure 10-1: Worksheet Status Report Dialog
Figure 10-2 shows an example extract from an HTML Worksheet Status Report:
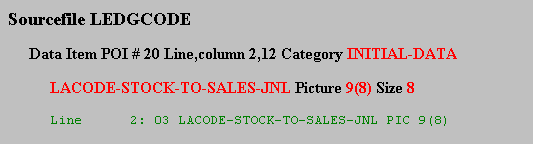
Figure 10-2: Worksheet Status Report Output
In this report, individual points of interest are listed, by component and with additional information such as the actual size of the data item indicated by its PICTURE clause. You can also view the information by source file and in summary.
Microsoft Access is a database product that can be used to design sophisticated reports. For this reason, you can export full, local worksheet detail into an Access database that contains a comprehensive collection of project and worksheet reports. These reports should prove an invaluable source of information as they stand but if you want to, you can modify them to suit your particular needs, augment them with new reports to provide the exact details that you require or export details for processing elsewhere.
To produce an Access database, click
Reports and then select Export worksheet details to Access.
The Access database is created by default in the current project directory
and called report.mdb. For full details on the contents of the
Access tables, look up Access database in the index of the help.
If the Access database already exists, you're asked whether you want to
overwrite it. If you don't, the Access browser shows the existing file.
There is a default Access database template, consisting of a collection of tables, queries, forms, macros and reports. When you select Export worksheet details to Access, the template is copied to the project directory and an outline of the project and full details on the Points of Interest (POIs) are copied to the new Access database. You can then run the reports directly or modify the queries, reports and macros to suit your own requirements. For permanent changes to the template, you can copy the default, make your modifications and set your new template as the one to use in the Export worksheet details to Access dialog.
Figure 10-3 shows the default database template, from which you can produce a variety of reports.

Figure 10-3: EuroSmart Access Reports
The default database template is repdefault.mdb. You should not make any changes to this template as your changes would be lost if you re-installed EuroSmart. If you want to create your own queries and reports, you should take a copy of this template and change the default value for the template identifier in the DatabaseIdentifier column of the Access Database Project table. You can then modify existing queries or reports or create new ones for your template.
By default, and where the Access report is appropriate, all points of interest are included. However, you can decide what points of interest categories to include and control the size of your report by doing so.
Click  Report
Categories from the Access Reports window to obtain the Categories
form and then work through the categories list, unchecking the ReportOption
box for any category you want to exclude from your reports.
Report
Categories from the Access Reports window to obtain the Categories
form and then work through the categories list, unchecking the ReportOption
box for any category you want to exclude from your reports.
Whenever you run a report, the category file is listed first, indicating which categories have been selected. You can also obtain a category subreport independently, if you want to document the categories you're using on your project. Figure 10-4 shows a category subreport.

Figure 10-4: Category Subreport
In addition to generating Access reports for immediate viewing, you can also export reports and basic data from the Access database, specifying the output format so that you can process it further in, say, Excel or Word:
Click  Export
from the Access Reports window and then click:
Export
from the Access Reports window and then click:
in order to select from the various options available. Then click Export again to specify your export options.
Figure 10-5 shows the export options that you can specify. For full details on these options, look up Exporting Access database in the index of the help.

Figure 10-5: Export Options
The export options allow you to produce format suitable for web browsers, word processors and spreadsheets. Delimited text signifies that the data is produced as comma-separated variables.
If the Access database does not give you sufficient reports on, or access to, your worksheet data, you may want to write your own reporting program or program for interfacing into an existing reporting system.
You can export worksheet details to an ASCII tag file, which is similar in format to a Windows .ini file. Each section starts with a section header, enclosed in square parentheses, and contains one or more lines, each of which specifies a name and an associated value. See the online help for full details on the contents of the ASCII tag file.
An ASCII tag file enables you to export worksheet details to another application. It corresponds to, and is sufficient to build, the Access database which can be generated directly via the Export worksheet details to Access reporting option.
To produce a tag report, click on
Reports and then select Export Worksheet Details to ASCII.
The tag file is saved by default in the current directory and called report.tag.
You can choose to produce a full report (all worksheet items are shown, including those marked as discarded) or to limit the report to just those items that are currently displayed in the worksheet.
You can change the default directory and/or filename to which the report is saved using the Browse... button or by simply overwriting the highlighted text.
You can produce a summary of the points of interest in the worksheet by
project component, by clicking
Reports and selecting Assessment Report. You can then
specify options for the report. For help on these options, click the
in the top right corner
of the dialog and click the item you want help on.
Figure 10-6 shows a typical Assessment Report:
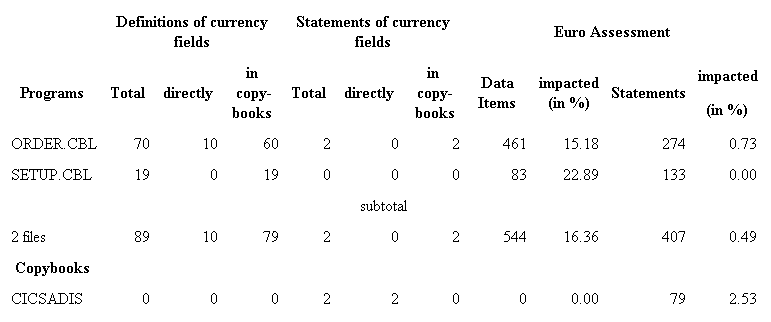
Figure 10-6: Assessment Report
This report gives statistical information regarding the incidence of monetary points of interest in the project components, expressed both in actual figures and as a percentage of all data items and statements in the database.
This report is useful if you are trying to obtain a rough assessment of the amount of effort required to convert your application to the euro.
You can produce a report on all file-based data items used in the
project by clicking Reports
and selecting File Impact Report. You can then specify options for
the report. For help on these options, click the
in the top right corner of the dialog and click the item you want help on.
Figure 10-7 shows a File Impact Report:
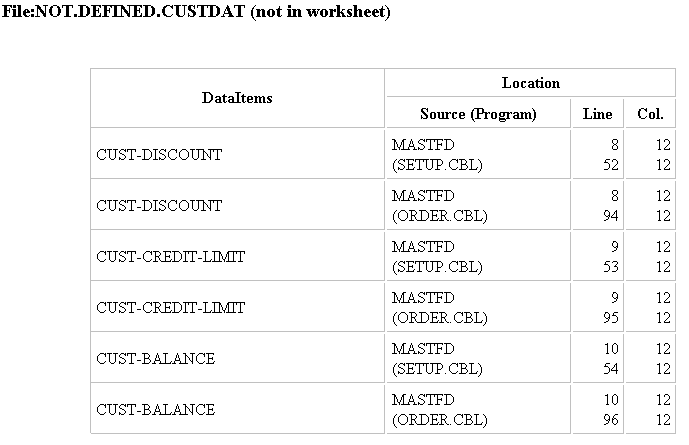
Figure 10-7: File Impact Report
The sample above shows the location of the definition for each data item and the first statement using it.
Copyright © 1998 Micro Focus Limited. All rights reserved.
This document and the proprietary marks and names
used herein are protected by international law.
| The Worksheet and Group Working | Using Revolve | |