
| Associating Code with Annotations |
This tutorial describes
You need to have read the chapter Start Here for the Tutorials! and worked through the first session, Creating and Loading Projects, before you do this session.
In this session, we assume that you have created Sample.prj.
You can use Revolve to explore the structure of an existing system. Through the use of Views you can actually move step-by-step through an illustration of data movements in your source code. In this exercise you will learn how to use various Views in conjunction with the Integrated Editorand the Execution Simulator to find a JCL job and make modifications.
Views provide graphical overviews of your system and different modules in your source code. They enable you to study your application to navigate the execution sequence. Views are good resources for system reference when you're not quite sure where to start or what information you need.
You will apply the procedures in this session to the sample project created in Creating and Loading Projects. If Revolve and sample.prj are closed, open them like before.
In this session you:
To do this:
The System view illustrates the calls that link programs in the project together. It displays icons that depict the project's different programs as well as other system items. Between the icons are the links that connect them. The icons and links are representatives of actual source code entities.
This system contains a JCL job.
The Find dialog enables you to isolate information in the System view.
The JCL job card icon represents the JCL job.

Figure 10-1:System View
This opens the Split Screen Editor where the source code for the JCL job is displayed.
The Inventory view graphically depicts the steps, DDs, executables, and databases in the JCL job.
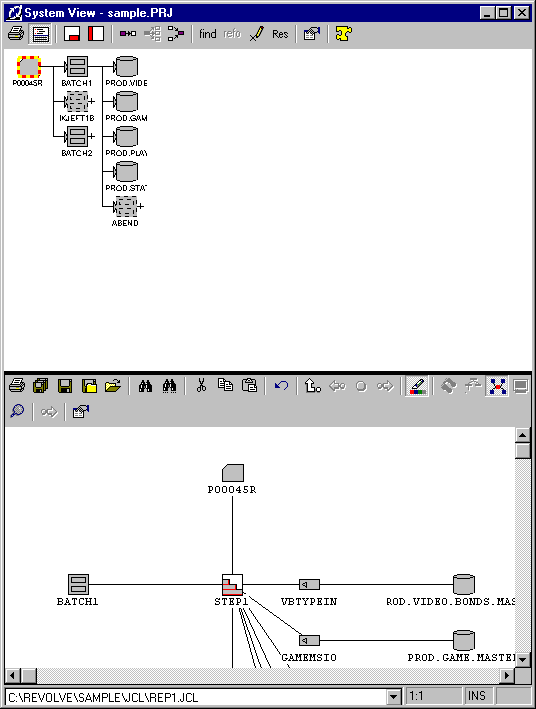
Figure 10-2: Viewing Graphically in the Information Window and Editor
BATCH1.CBL is the selected element. Notice it is selected in the System view.
The Inventory view closes and is replaced by the Split Screen Editor displaying the source code for the program BATCH1.CBL.
You have isolated a program by using the graphical views. Continue on in the analysis of BATCH1.CBL in the next tutorial. Do not close any windows or tools.
To explore the logical steps of BATCH1.CBL as identified in the previous tutorial:
The Execution Simulator tool bar appears. This indicates that the Execution Simulator is invoked and ready.
The code executes slowly, while displaying the logical procedural flow. Notice the walk through is displayed, item by item, in the Execution Path display.
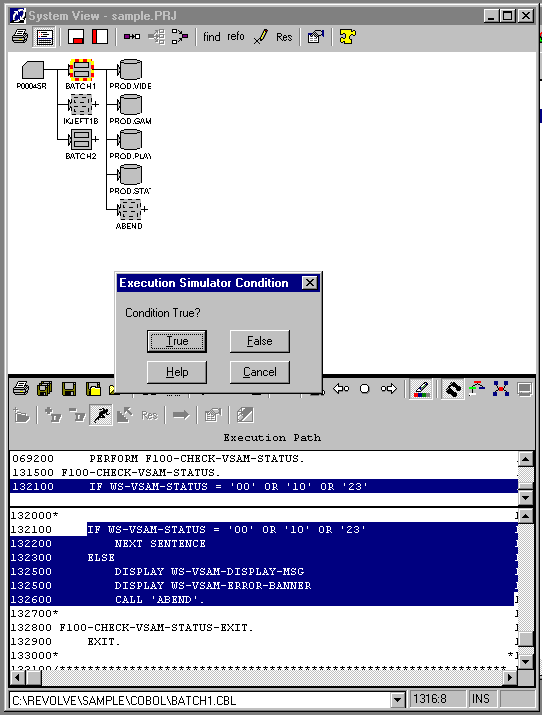
Figure 10-3: Execution Simulator Condition Prompt
The Execution Simulator Condition prompt appears when an IF statement in the code is encountered.
To measure the metrics for your program:
The window fills with programs.
The window fills with
![]() paragraphs.
paragraphs.

Figure 10-4: Metrics Tool
Sort the paragraphs by the number of branches.
The Metrics window updates to display the complexity measures for each item in the program.
The paragraph A300-TERMINATION-RTN has a Cyclomatic measurement of 10, anExtended measurement of 10, and an Essential measurement of 1.
To see how the selected paragraph is called, create a flow chart of the program:
The Split Screen Editor displays the source code for the selected paragraph.
The paragraph A300-TERMINATION-RTN is outlined everywhere it is called.

Figure 10-5: Code Flow in Editor
The Code Flow view represents paragraphs as rectangles, PERFORMs as black squares, GO TOs as black arrows, and "fall-throughs" with vertical lines. As with any other view, code flows can be printed.
The Print dialog is invoked. Print outs include indices and can be valuable for system documentation. The Legend check box gives you the option of printing a legend that describes the icons used in the view.
Along with Code Flow, all of the windows, Metrics, Inventory, etc., can be printed in a similar fashion.
You can close Revolve, if you want to stop for now. The project that you have created and loaded is automatically saved.
You can continue with the next tutorial later, by simply reopening the project.
Copyright © 1999 MERANT International Limited. All rights reserved.
This document and the proprietary marks and names
used herein are protected by international law.
| Associating Code with Annotations |