 previous
 next
next

The Client Console is a GUI application that allows you to view and manage your data sources. You can accomplish each phase of the replication process by using menu commands and options.
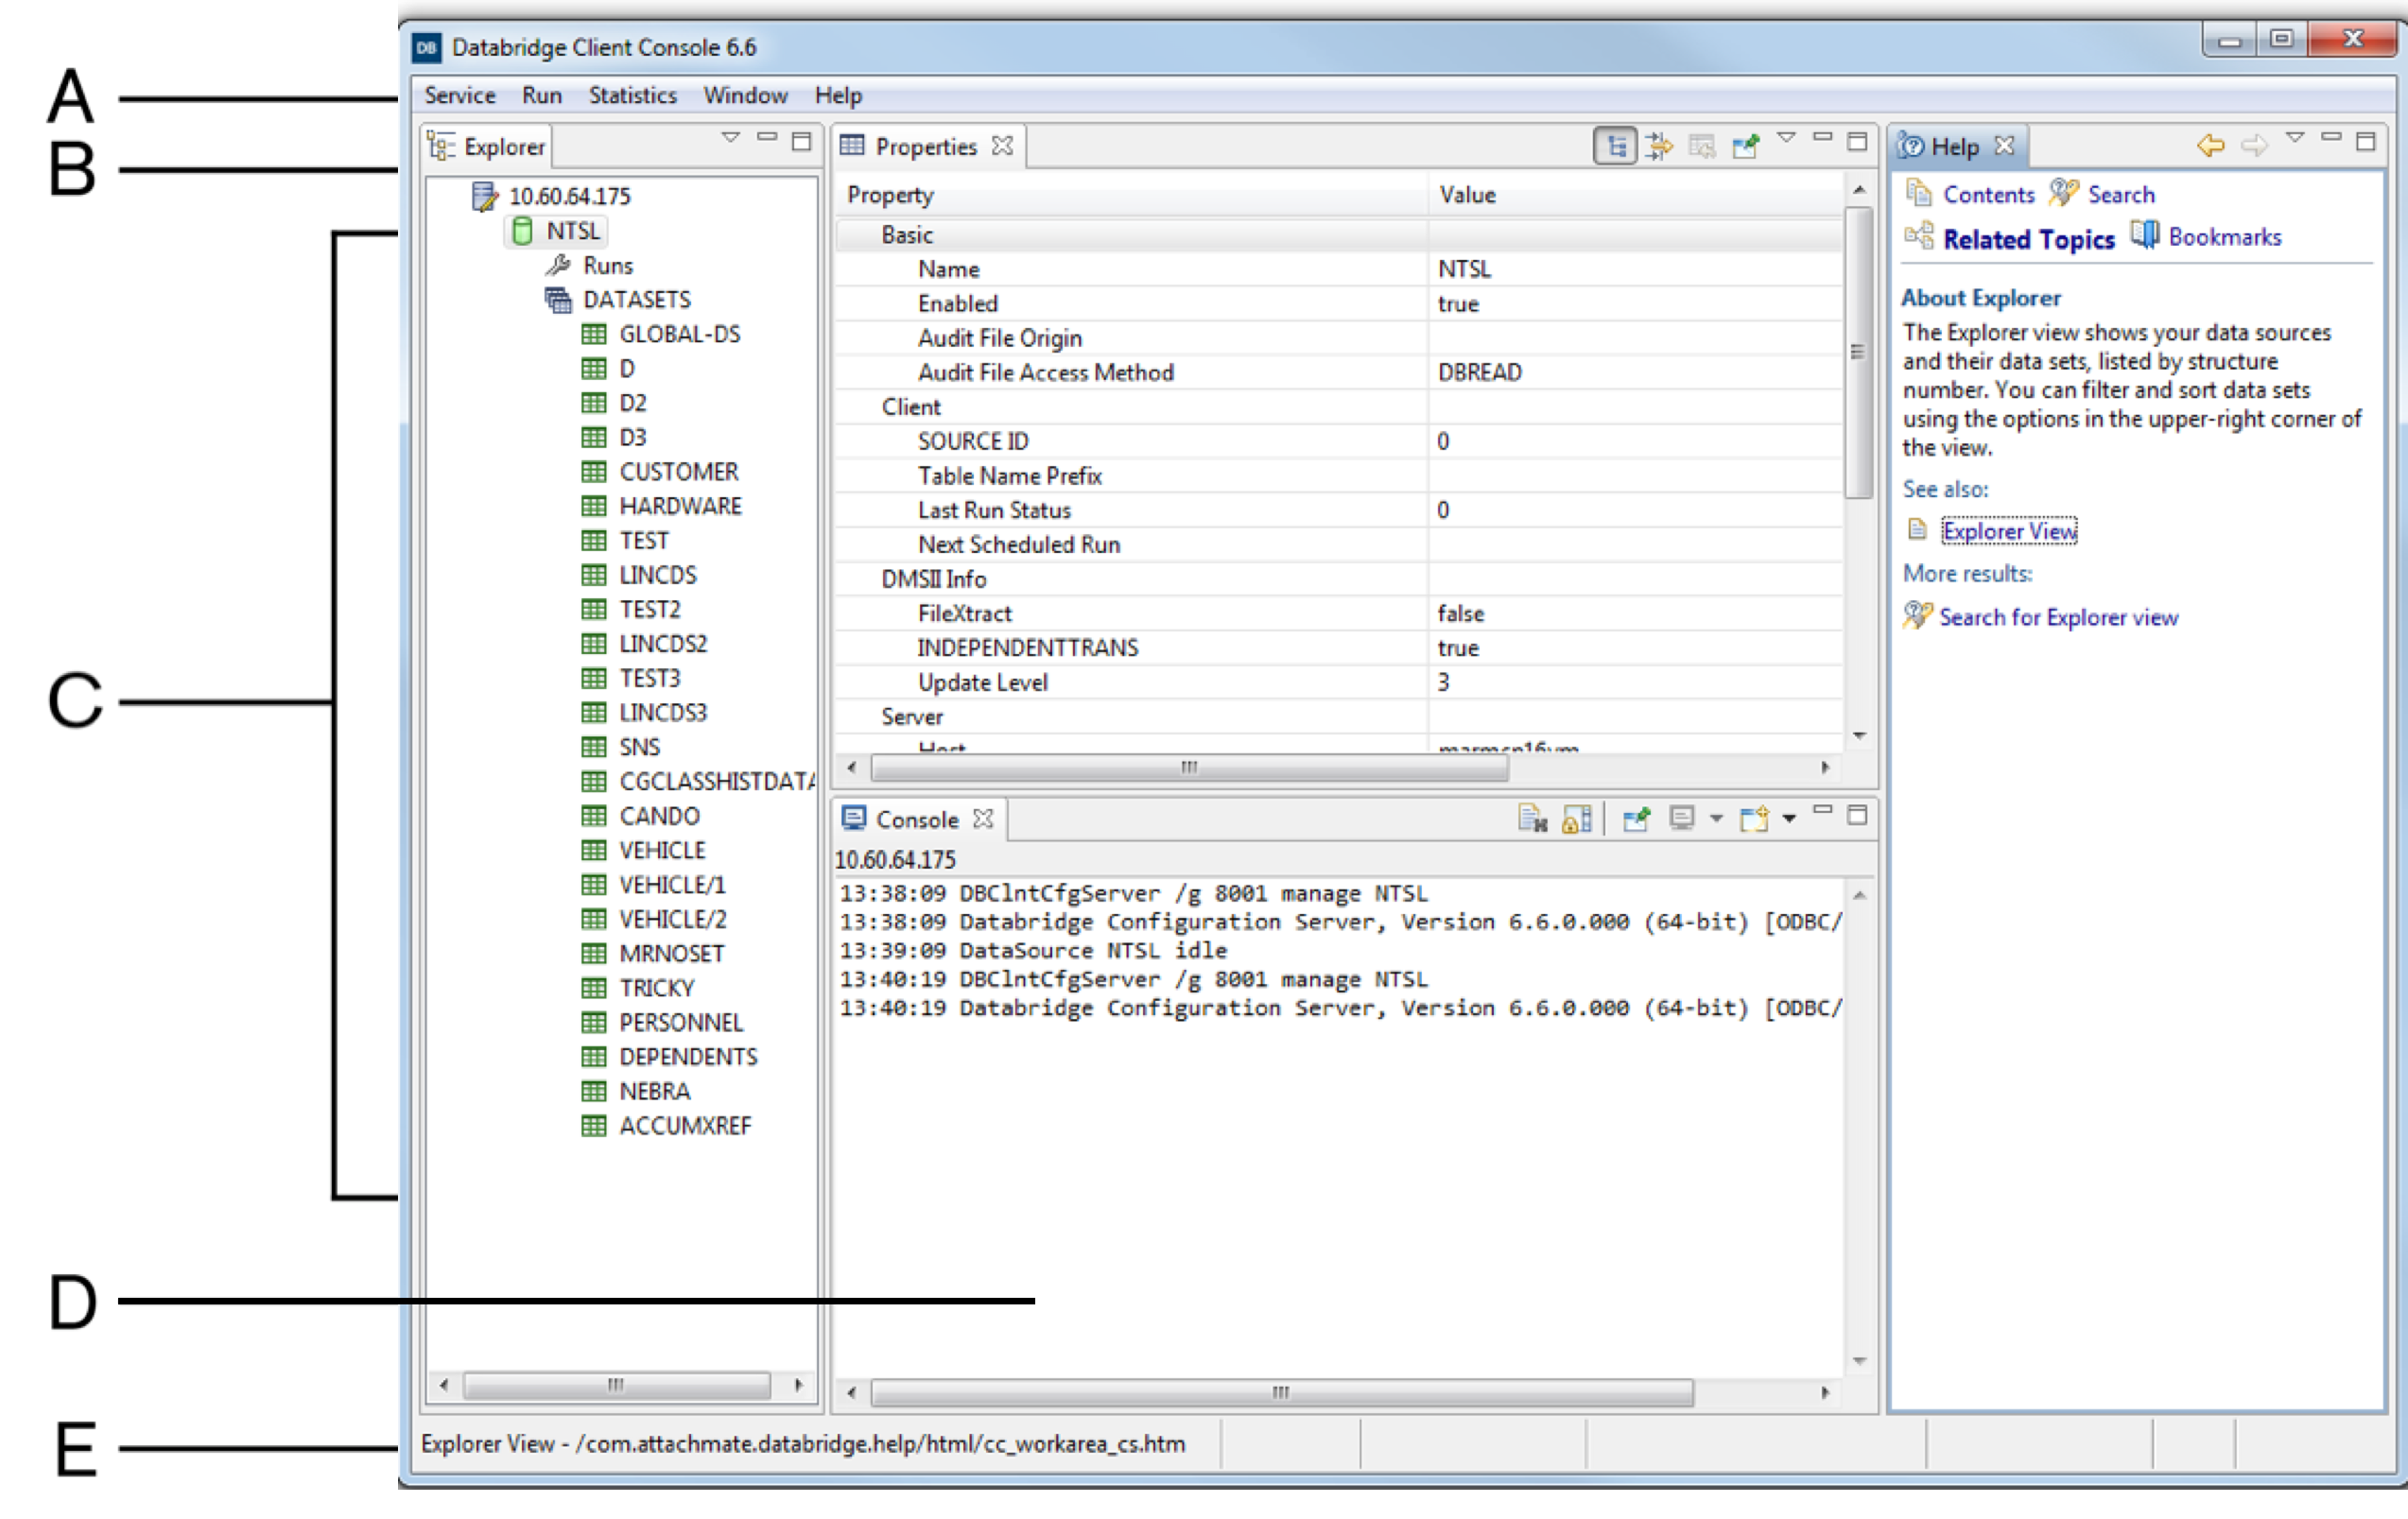
Client Console Work Area
The Client Console work area ( Figure 1) is divided into multiple panes that display different types of information; for example, , , , and . You can arrange the panes within the application window by clicking a pane’s title tab ( Figure 1-B) and dragging it to a new position.
Menu Bar
The ( Figure 1-A) is context-sensitive, displaying different menus depending on which pane you are working in, and sometimes depending on which component (e.g. data source, data set, or service) you’ve selected within the pane. You can also access many of the menu items listed in the menu bar by right-clicking a component within a pane to open a pop-up or context menu.
Explorer Pane
The pane displays a tree of the service nodes and their associated data sources that are maintained by a connected Databridge Client Manager service. Data sets are listed by structure number. You can filter and sort data sets using options from the pane menu ( Figure 2-C).
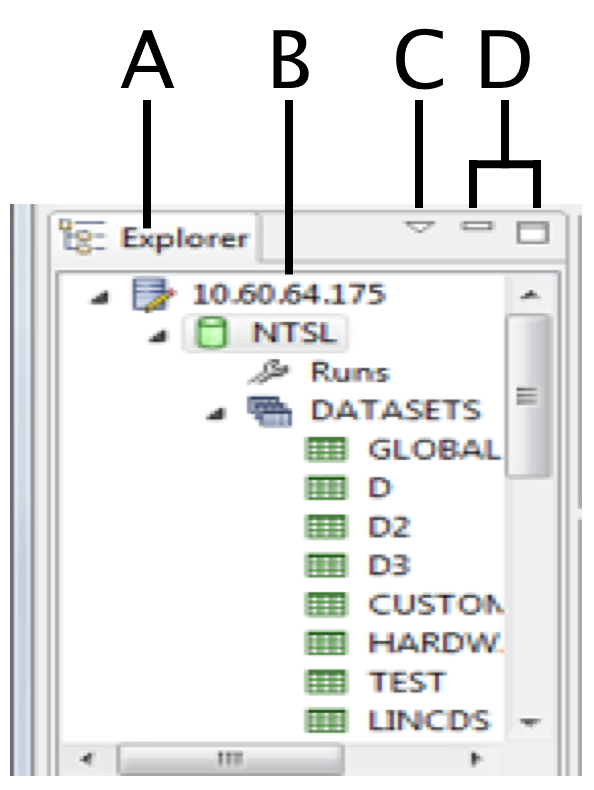
Within the pane ( Figure 2), you can select a service, a data source, or any of its related items in the tree view by clicking on it (you can tell which item you’ve currently selected by looking for the blue highlight, Figure 2-B) to activate items on the specific to data sources, e.g. the menu ( Figure 1-A). Alternatively, you can right-click a service, a data source, or any of its related items to open a pop-up or context menu ( Figure 3).
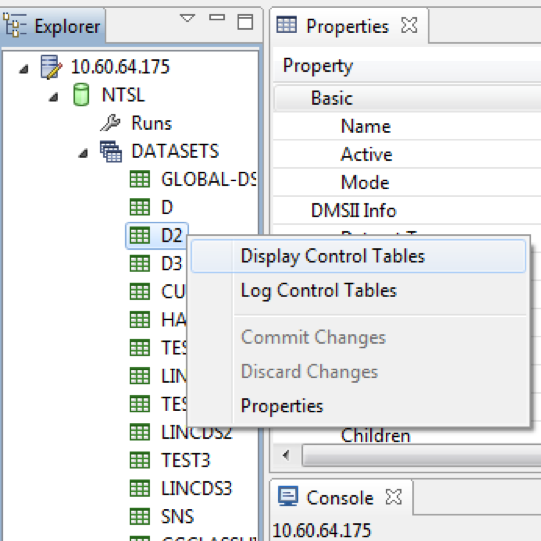
Figure 3 - Explorer Pane pop-up menu
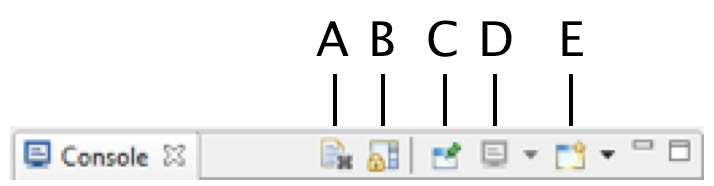
Console Pane
The pane (Figure 4) displays Client-related activity for each data source, including log output, exit codes, and commands. (This information is the equivalent of the program output displayed when running the command line Client.)
You can open dedicated panes for each individual data source by using the Open Console control ( Figure 4-E). The Pin Console control ( Figure 4-C) lets you keep a particular console on top.
Status Line
At the lower edge of the Client Console window, the ( Figure 1-E) shows the status of the connection to the currently selected service and currently active run and whether additional user input is required to complete a task.
When a process command is running, additional fields display audit file processing information: the Audit File Number (AFN), the Audit Block Serial Number (ABSN), a progress bar for the designated audit file, the current DMS II AFN, and lag time. Lag time is the elapsed time between when an update is applied in the DMSII database and when it appears in the relational database.
If multiple data sources are processing at the same time, the will cycle through each data source status in five-second intervals.
When you close the Client Console, all information is lost except the services to which the console is connected, whether to automatically connect to a given service at startup, and the layout of the Console window.