Exploring a Snapshot
Following is an example of a snapshot. The views are linked; click a node in the snapshot view to see its details in the patterns view.
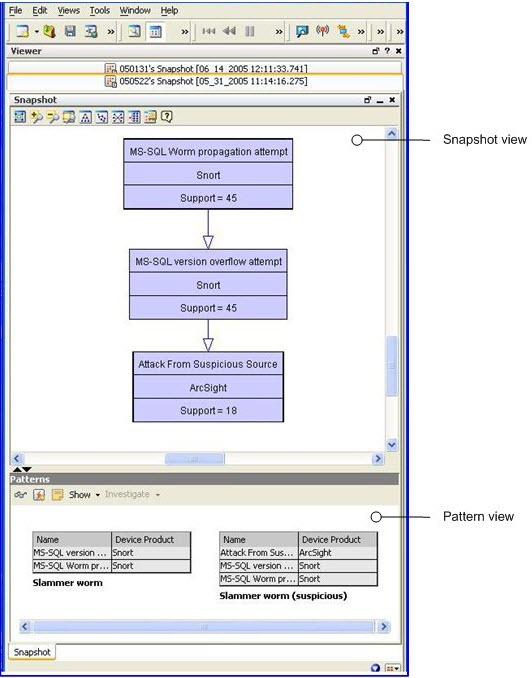
The upper part of the Viewer panel presents the snapshot view, which shows a hierarchy of related event nodes.
The lower part of the Viewer panel is the patterns view, which shows blocks of events from the hierarchy that are most closely related. Each block of events represents one specific path through the pattern hierarchy.
The example shows two patterns and a demarcation point (between support = 45 and support= 18). The top two events are the SQL worm. The last event is generated by the system. Pattern Discovery classified 18 of 45 sources as suspicious. There are 27 sources that ran the slammer worm in the network, but they were not added to the suspicious list. This discovery enables you to investigate why all 27 systems were not caught by the other surveillance mechanisms in place on your network. Determining that will help you to tighten your network security.
The “support” value for each node is the number of times that event occurred with its related events. The higher the number, the higher the item appears in the hierarchy.
For example, in the following image, there are two points at which there are sharp differences in support from one item to the next. This shift in support level is called a demarcation point, and indicates a sub-pattern in a longer sequence.
The demarcation points indicate attack stages, and sometimes variations of the same type of attack on different network systems. For example, the SQL worm propagation attempt makes up 1000 of the 1122 hostile attempts. The demarcation point in the center of the graphic shows that there are two variations: attack from suspicious source, and UDP packet tcpdump. This can indicate how different systems process the same type of SQL worm attack. Demarcation points are circled, as shown:
