Step 5 - Create a Report
A report is an ArcSight resource that binds data from a query or trend to an existing report template. Once run, the results of a report can be viewed in the ArcSight Console’s Viewer panel, saved (archived), and/or exported in a variety of formats. Reports can be scheduled to run at regular intervals, and also can be run on demand as needed.
Reports are described in Creating or Editing a Report, and an overview of the whole topic is provided in Understanding the Reporting Workflow.
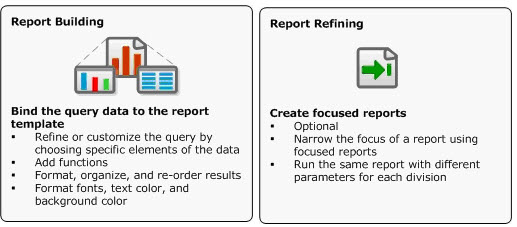
Focused reports enable you to run the same report definition on different subdivisions of the data without having to copy and modify the master report every time. For example, you can run an individual Top 10 Infected Systems report for each of your business divisions.
The job scheduler enables you to schedule reports and focused reports to run automatically at specific time intervals. (The job scheduler is also used as a part of building trends which, by nature, involve scheduling.)
Note: Queries and trends are intended to capture data. Reports are used to display the data from queries and trends. For example, if you wanted to run monthly or quarterly reports on VPN login statistics, you would first create one or more queries to capture the data, then create trends (based on the queries) to define a schedule for running the queries and storing the results, and finally create and run reports on the trends. For a full walk-through of this process, see End-to-End Reporting Examples.