Alerts by Origin
The Alerts by Origin widget in the CISO Overview optic displays the geographic distribution of alerts for the specified time and filters.
The red dots on the map indicate the locations that are the sources of alerts and the dot size is directly proportional to the volume of alerts. The higher the number of alerts at a location, the bigger the dot. The color of the dots varies depending on the priority level of the alerts at the location.
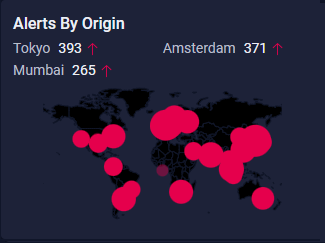
The widget displays the top 3 locations with the highest number of alerts and the change in the alert count between the selected time frame to the previous time frame. A green downward arrow ( ) indicates a decrease in alert count, while a red upward arrow (
 ) indicates an increase in alert count.
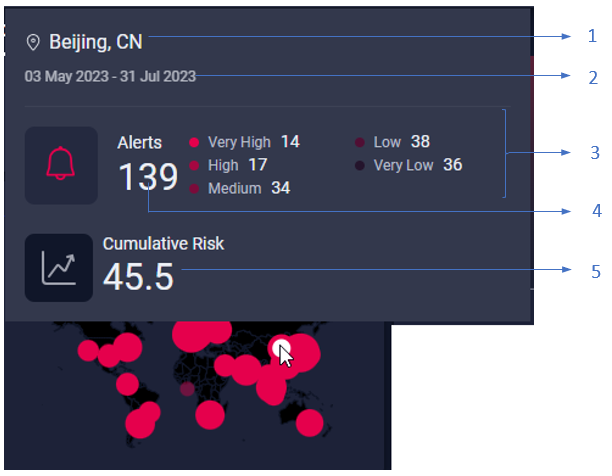
Mouse over a dot as shown in the preceding image to view the following information:
-
1 - Name of the location that is the source of alerts.
-
2 - Duration for which the widget is displaying alert data.
-
3 - Alert count by priority.
-
4 - Total number of alerts at the location for the specified duration and filters.
-
5 - Cumulative risk score.