Alerts Over Time
The Alerts Over by Time widget in the CISO Overview optic provides insights into the volume and frequency of alerts over the specified time and filters.
Quick View of Alerts Over Time
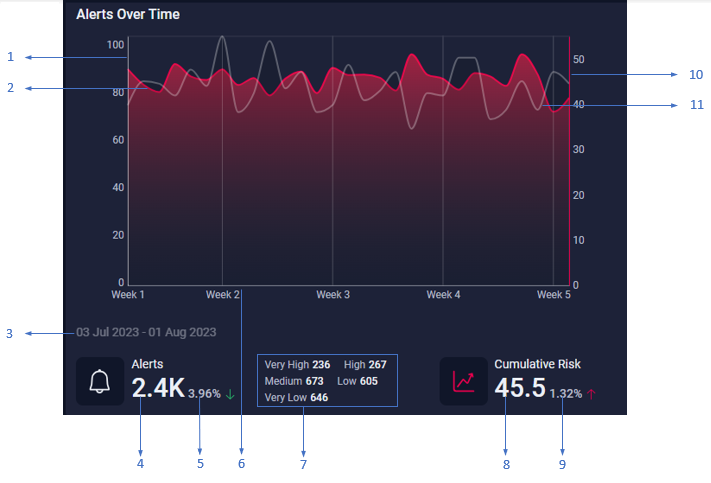
The widget displays the following information, as shown in the preceding image:
-
Primary vertical axis that represents the number of alerts.
-
Trend line that represents the cumulative risk score for the specified time.
-
Duration for which the widget is displaying alert data.
-
Total number of alerts for the specified time. When you click the alert count, a fly-out provides deeper insights into the alert count.
-
Percentage change in the alert count when compared to the previous time frame. For example, if you select , the system compares the data of this week to the previous week and if is selected, the system compares the data of this month to the previous month. A green downward arrow (
 ) indicates a decrease in alert count, while a red upward arrow (
 ) indicates an increase in alert count.
 -
Horizontal axis that represents the specified time. Depending on the selected time frame, the horizontal axis displays the time in chronological order at specific intervals such as days, weeks, months, or quarters. When you click an interval label on the horizontal axis, the portion of the chart that corresponds to the interval is highlighted, and the data below the chart is updated to display the metrics for the selected interval.
-
Alert count categorized by priority.
-
Cumulative risk score for the specified time.
-
Percentage change in the cumulative risk score when compared to the previous time frame.
-
Secondary vertical axis that represents the cumulative risk score.
-
Trend line that represents the alert count for the specified time.
As you mouse over a trend line, the data below the chart is updated to display the metrics for that day.
Analyzing Alerts
When you click the total alert count in the widget, a fly-out pane displays the distribution of alerts by alert type.
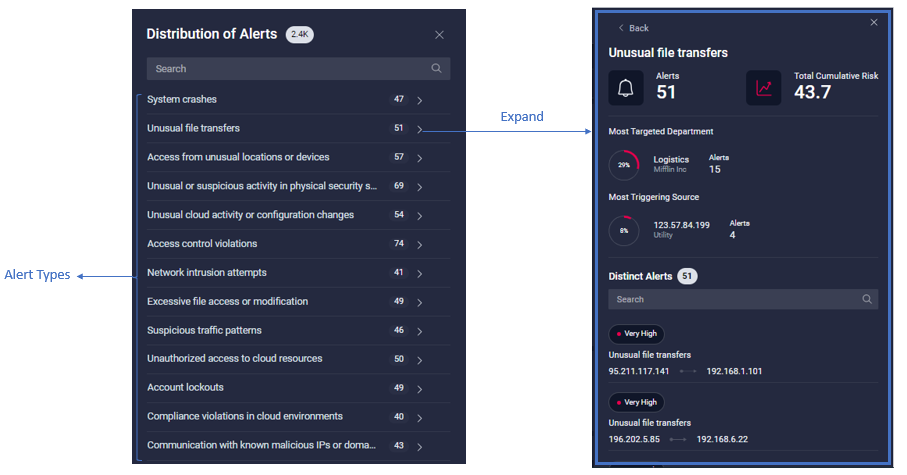
Expand an alert type to further drill down and view the following information, as shown in the preceding image:
-
Number of alerts for the alert type.
-
Total cumulative risk score for the alert type.
-
Name of the department that is most affected by the alert along with the alert count. The donut chart highlights the percentage of alerts contributed by the alert type to the overall alert count.
-
IP address of the source that is triggering the alert the most along with the alert count. The donut chart highlights the percentage of alerts contributed by the source to the overall alert count.
The Distinct Alerts pane lists all alerts under the alert type. Although the listed alerts are of the same type, each alert has a distinct source and destination IP address. You can search for a specific alert by the source or destination IP address.
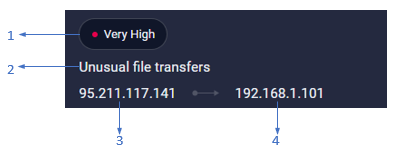
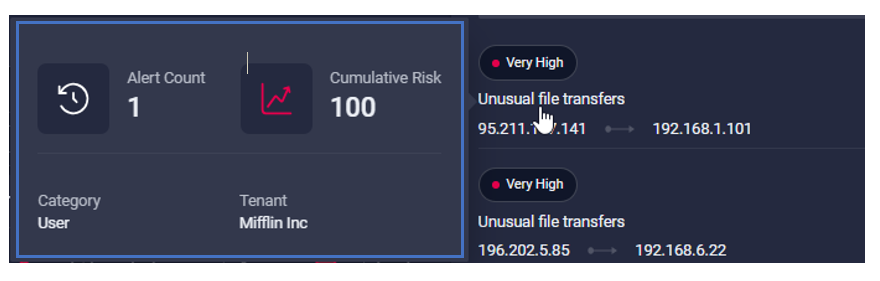
For each alert in the list, you can view the following information as shown in the preceding image:
-
1 - Priority of the alert.
-
2 - Alert type.
-
3 - Source IP address of the alert.
-
4 - Destination IP address of the alert.
-
Mouse over the alert name as shown in the following image, to view the number of times the destination IP address has been targeted by the source, cumulative risk score, and alert category.
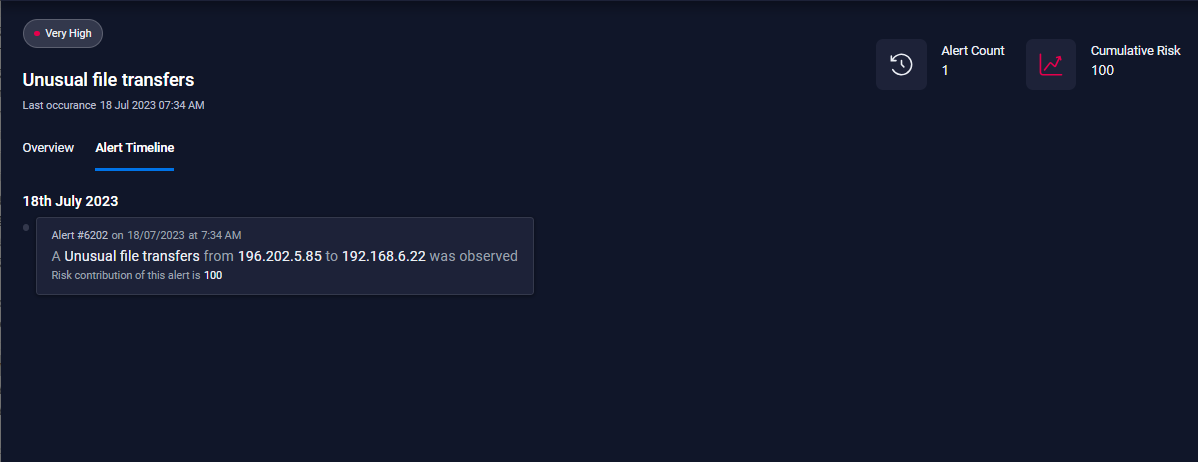
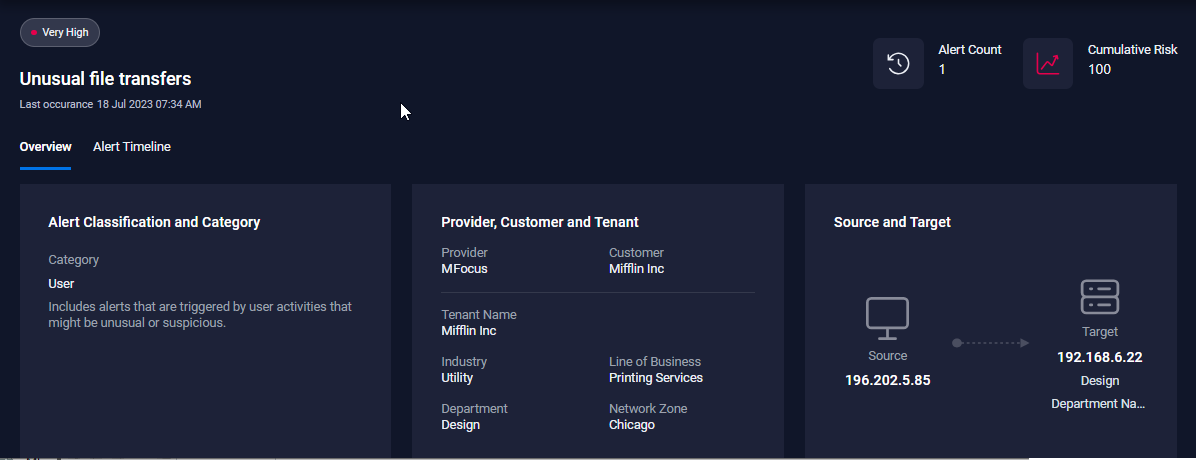
Viewing Alert Details
Click the alert name in the Distinct Alerts pane. The tab provides detailed information about the alert.
Viewing Alert History
The tab provides a recent history of alert activity. Each notification in the timeline includes the date and time the alert was generated, the source and destination IP address of the alert, and the risk score.