Enterprise Alert Categories
The Enterprise Alert Categories widget in the CISO Overview optic shows the top 6 alert categories with the most alerts over the specified time and filters. Each alert corresponds to a category. For example, categories might include malicious activities, unauthorized access attempts, policy violations, and so on. Grouping alerts based on categories provides insights into the nature of security risks faced by organizations and helps you prioritize actions.
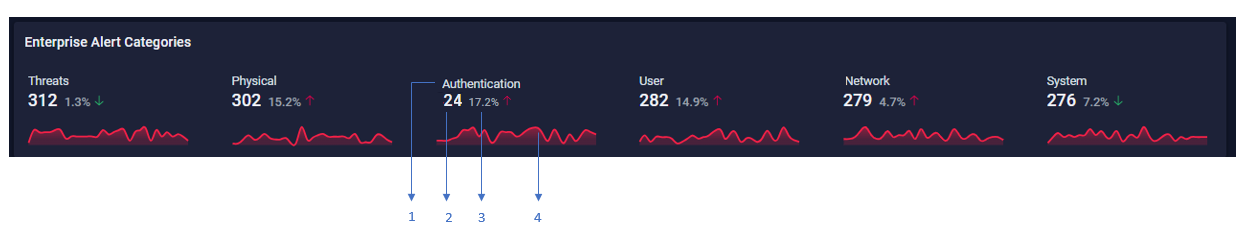
As shown in the preceding image, each alert category in the widget displays the following information:
1 - Name of the alert category.
2 - Total number of alerts in the category.
3 - Percentage change in the alert count when compared to the previous time frame.
4 - Alert trend over the specified time.
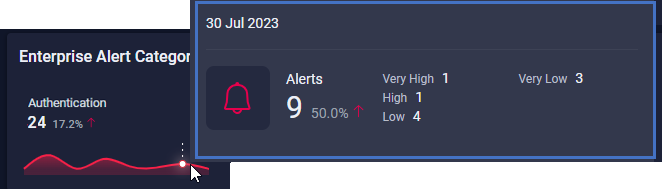
Mouse over the trend line to view the following details:
-
Total number of alerts along with alert count by priority.
-
Percentage change in the alert count when compared to the previous day.
Analyzing Alerts in an Alert Category
When you click the total alert count in a category, a fly-out pane displays the distribution of alerts by alert type.
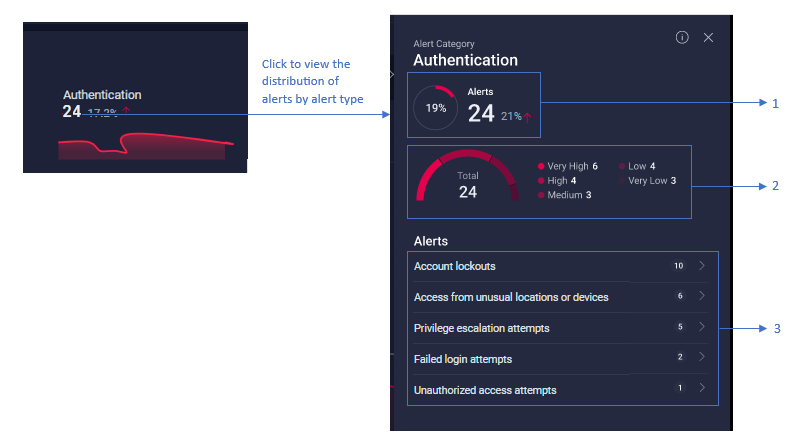
As shown in the preceding image, the fly-out pane displays the following information:
-
1 - Number of alerts in the category along with the percentage change in the alert count when compared to the previous time frame. The donut chart highlights the percentage of alerts contributed by the alert category to the overall alert count.
-
2 - Distribution of alerts in the category by priority. Depending on the priority levels existing for the selected time, the semi-circle donut chart is divided into segments, each of which is colored differently. Each segment represents a priority.
-
3 - Classification of alerts by alert type along with the alert count.
Expand an alert type as shown in the following image to explore all alert instances under the alert type.
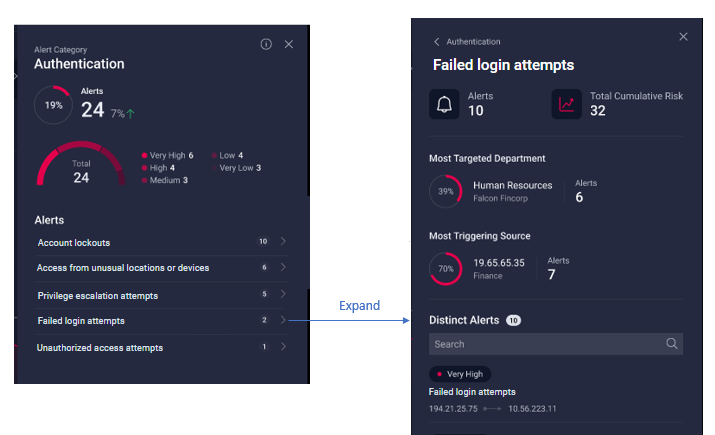
As seen in the preceding image, the following information is displayed:
-
Total number of alerts within the alert type.
-
Cumulative risk score for the alert type.
-
Name of the department that is most affected by this alert type along with the alert count. The donut chart highlights the percentage of alerts contributed by the alert type to the overall alert count.
-
IP address and name of the source that is triggering this alert type the most along with the alert count. The donut chart highlights the percentage of alerts contributed by the source to the overall alert count.
-
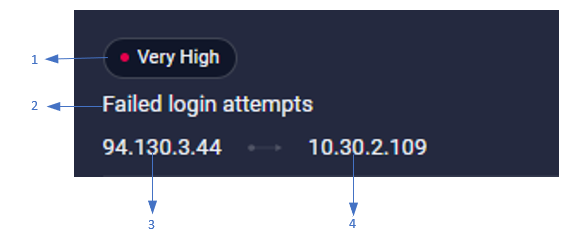
List of all alerts with the following information for each alert as shown in the following image:
-
1 - Priority of the alert.
-
2 - Name of the alert.
-
3 - Source IP address of the alert.
-
4 - Destination IP address of the alert.
-