Risk by Industry
The Risk by Industry widget in the CISO Overview optic displays a trend chart for the top three industries with the most alerts for the specified time and filters.
The white trend line represents the alert count, while the red trend line represents the cumulative risk score.
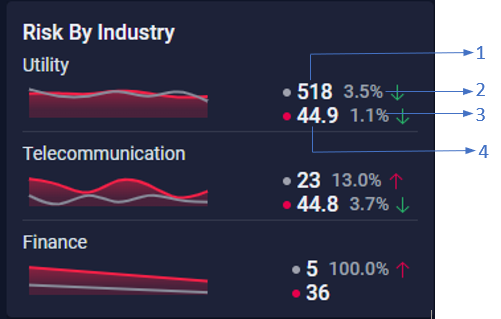
As shown in the preceding image, the widget displays the following information for each industry:
-
1- Total number of alerts for the industry for the specified time.
-
2 - Percentage change in the alert count when compared to the previous time frame.
-
3 - Percentage change in the cumulative risk score when compared to the previous time frame.
-
4 - Cumulative risk score for the industry for the specified time.
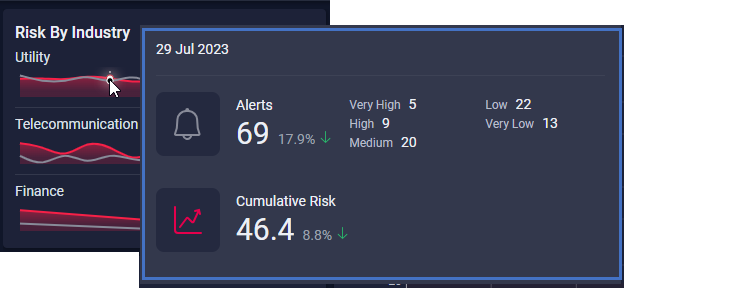
When you mouse over a trend line as shown in the following image, you can view the following details for that day: Total number of alerts for the industry along with alert count by priority, cumulative risk score, and percentage change in the alert count and cumulative risk score when compared to the previous day.