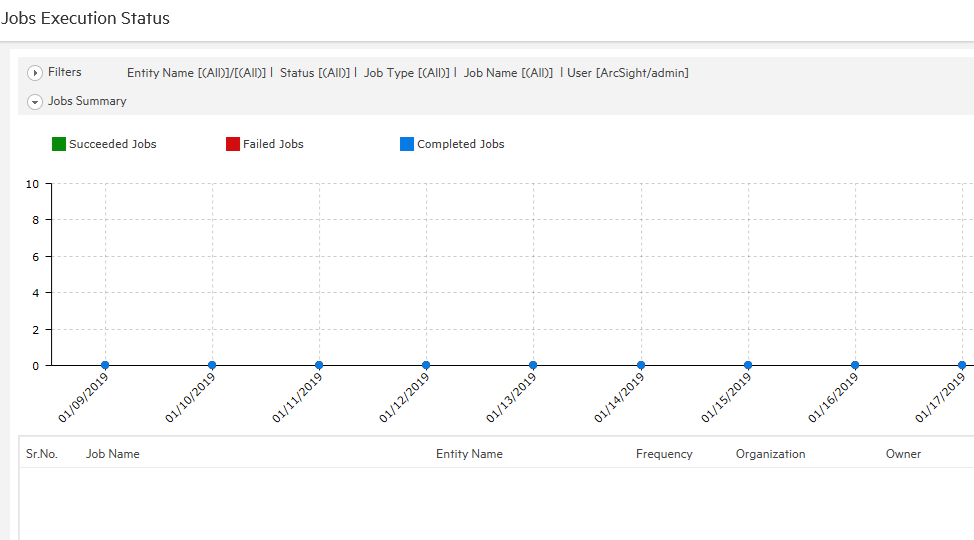
The status of your scheduled reports can be displayed from this option. To open the Job Execution Status Page, go to Reports > Administration > Job Execution Status
Execution status of all the reports executed through scheduling or reports that ran in background can be viewed on Job Execution Status page. This page also lists reports that are currently executing and reports that are coming up for execution.

Data is displayed as Line chart and table.
By default, data of jobs executed in the last 7 days is displayed. For example, if today is June 8 2018, data of jobs having execution date between June 1, 2018 and June 8, 2018 will be displayed.
Chart depicts jobs execution status in a line chart (by date) for Completed jobs, Succeeded Jobs, Failed Jobs and Upcoming Jobs. For time filters of 3 days or less, the resulting chart will display hourly data. Applying a filter effectively changes the chart being displayed.
To view the point value, click the corresponding line and move the cursor to the point. A callout will be displayed showing the point value. Clicking the data point will produce a pop-up window containing job detail pertaining to the clicked point. To disable the value pop-up, the click corresponding line again.
The chart tab is collapsible. Click the chart title to hide the chart tab. Click the title again to open the chart tab.
For each job, the following details are listed:
The Frequency value of one-time jobs will be displayed as blank.
When the page opens, the Filters tab remains collapsed. Click the tab-header to expand it. The tab-header also displays current filter settings. By default, it displays the first 500 jobs (no filter for report name, Owner). Listed jobs can be filtered by:
Entity Type: Select a report/Query. Choose a folder to select all the reports/queries in it. Click to open the object selector to make selection.
Job Name: Name of job.
Job Run-Time: Select (All) to view all jobs, select Completed to list jobs already finished (both successes and failures), Scheduled to list the jobs that are currently executing and select Pending to list jobs that are yet to be executed.
Status: Select Success, Failure or All to include only the respective outcomes.
Date From and To: Dates between which the jobs were or are to be executed.
Job Type: Select All, to include all type of jobs; Now, Once, Recurring to include the respective types; Background to include jobs run in the background, Post Approval to include the jobs that executed reports supposed to undergo an approval process.
Frequency: Available when the selected Job Type is Recurring, select among Daily, weekly, monthly or All.
Select Owner: User who is owner of the job.
In Private Owned By, select None to not view any private jobs, Selected User to view selected user's private jobs, Selected Org to view private jobs of users belonging to the selected organization (in Select Owner) or ALL to view private jobs owned by all the users.
In Public Owned By, select None to not view any public jobs, Selected User to view selected user's public jobs, Selected Org to view public jobs of users belonging to the selected organization (in Select Owner) or ALL to view public jobs owned by all the users.
Show (selecting the number): Select Top 100 to view first 100 jobs from the filtered list, select Top 500, Top 1000 and Top 4000 to view first 500, 1000 and 4000 jobs respectively.
Provide filter criteria and click the Apply button. Jobs that comply with the filter criteria will be listed and plotted on the chart.