The Search Results page displays a histogram that provides a graphical representation of the events that match a search query. Depending on the type of search executed, the histogram is based on Logger receipt time or event time.
Results are presented in a histogram view emphasizing the time information (X axis) and the quantity of events (Y axis). You can also select multiple consecutive bars on the histogram to view matching events in all of the selected time units.
Note: The time range on the X-axis might not match the time range specified in the search query because the start and end times on the X-axis are determined by the event times of the first and last matching events of the search query.
A histogram is progressively built and displayed as events match a search query. If the search query needs to scan a large amount of data or a large time period, the histogram displayed initially might refresh multiple times while the query is running. To view the complete histogram of a search query, wait until the query has finished running (when the ![]() icon no longer appears in the Analyze > Search page).
icon no longer appears in the Analyze > Search page).
The first one million matching events are plotted on the histogram. If a search query matches more than one million events, an informational message is displayed on the screen. If you need to use the histogram view for event analysis of a search query that matches more than one million events, ArcSight suggests that you adjust the time range to retrieve less than one million events. This will allow you to obtain a complete and meaningful histogram. You can also use a pipeline operator such as top, head, or chart to further refine search results so that the total number of hits is under one million events.
You cannot disable the histogram; however, you can click the  icon above the upper-right corner of the histogram to hide it. To display a hidden histogram, click the icon again.
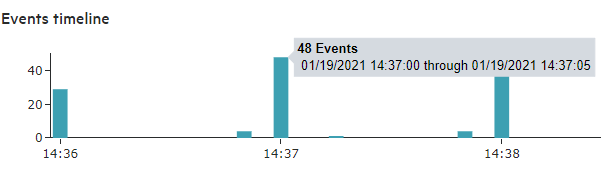
You can point to any histogram bar to highlight it and view the number of matching events and the date and time period that the bar represents. The matching events listed below the histogram do not change, and the histogram continues to display all matching events.
You can drill down to events in a specific time period by clicking the bar on the histogram that represents that time period. The bar you drilled down to is highlighted and the events matching that time period are listed below the histogram. To deselect the time period, click the bar again. To analyze the information from several items on the train, make sure these are in a consecutive order. Otherwise, Logger only shows the data of the last column selected.