You can configure Logger to alert you by email, an SNMP trap, or a Syslog message when a new event that matches a specific query is received or when a specified number of matches occur within a given time threshold. For more information, see Logger Alert Types. In addition to receiving an alert via email, an SNMP trap, or a Syslog message, you can view Alerts and the base events that triggered them on the Analyze > Alerts page.
To view Alerts, choose a predefined time range, such as “Last 2 hours” or “Today,” or choose “Custom Time Range” to reveal additional fields for specifying a time range manually. This aspect works like Search. Refer to Time Range for more detail. Alerts search only considers internal events. Consequently, no search type option is displayed for this functionality.
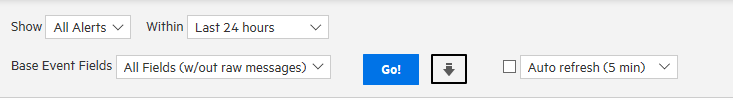
Name the alert after it has been created. Use the Show options to view only events associated with a particular Alert. The default is All Alerts.
Alert events are labeled as ‘Action Engine’ and are triggered by base events. You can also select whether to view the base events and which fields to view by using the Base Event Fields: option.
Like on the Search page, the Go button triggers the search, the Export Results button enables you to create a PDF or CSV file that contains the search results, and the Auto Refresh option determines whether and how frequently the displayed search results are updated.