Open topic with navigation
Summary
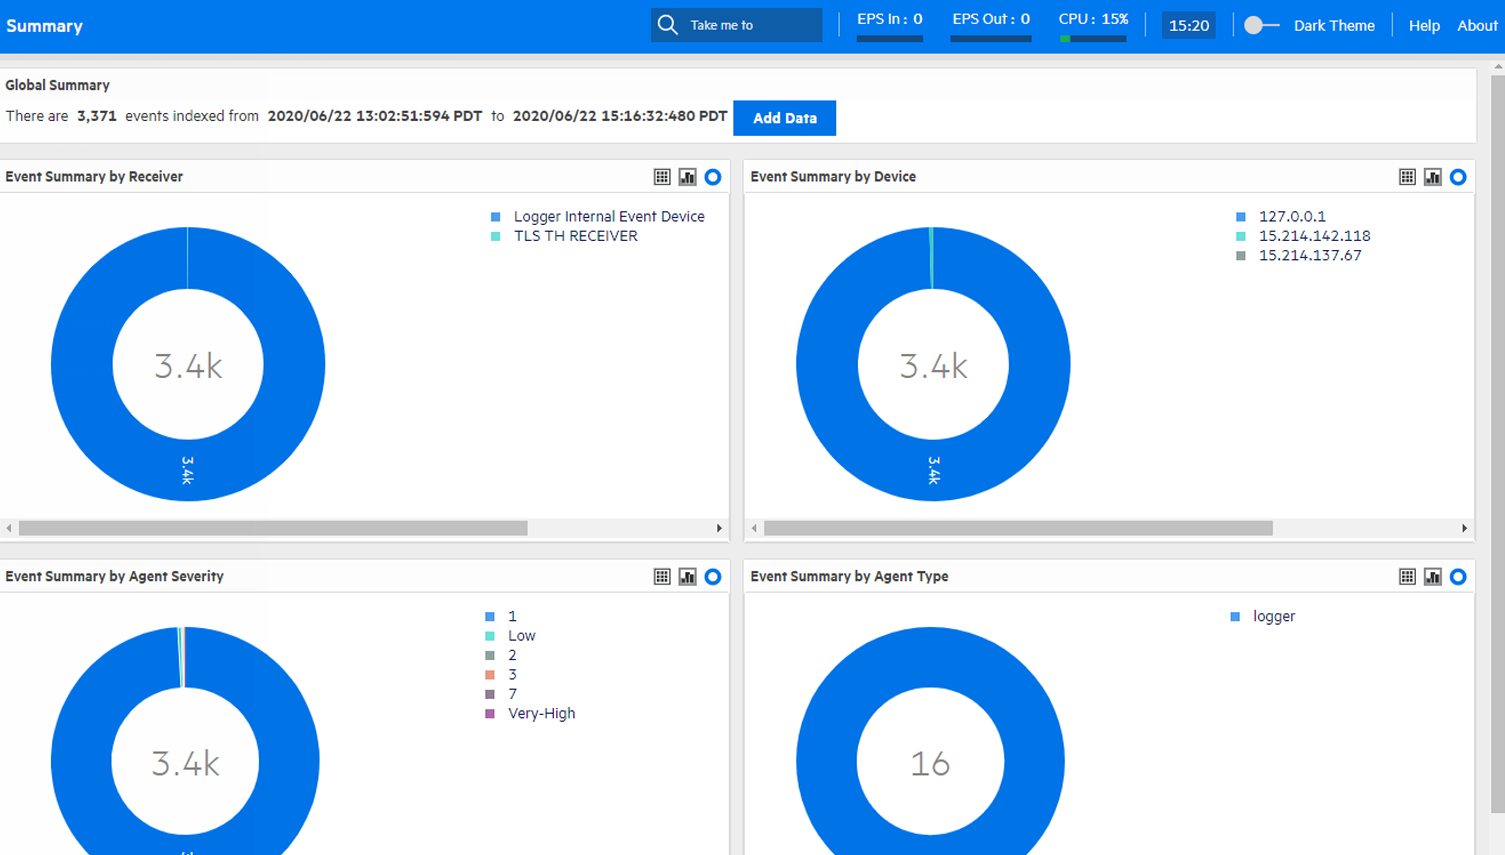
Logger’s default home page is the Summary page. (For information on how to use a different page as your home page, see Logger Options and Logout. ) The Summary page is a dashboard that provides summarized event information about your Logger in one screen. It enables you to gauge incoming events activity and the status of indexing. The events that are in Logger’s primary storage (not aged out due to retention or archived data) are used to generate the summary information.
Logger's home page, the Summary page, displays data in four panels. Each panel is displayed in a donut chart by default. You can change the display setting for each panel by clicking the appropriate icon.
- Select
 for a list.
- Select
 for a column chart.
- Select
 for a donut chart.
Note: Donut charts display an event total in the middle of the donut. This is the total number of events displayed in that chart. If the number of events is more than 1000, the event total is displayed using the appropriate standard metric prefix (k, M, G, T).
The panels on the Summary page can display up to 30 items. If there are more than 30, the panels display the top 30, by count.
Logger’s Home Page: The Summary Page
Point to a column, donut slice, or item in the legend to display information about it. For even more details, you can drill down to view the events by a specific resource—receiver, device, agent severity, or agent type. To do so, click the column, donut slice, or list resource to search for those events. The Search page opens and the search box is automatically populated with the search that generated the information you clicked on the Summary page. The Start and End fields are populated with the time of oldest events stored on your system (that have not aged out due to retention) and the current time, respectively.
For example, if you click Logger Internal Event Device under Event Summary by Receiver, the Analyze > Search page opens with the following query populated:

and the search is automatically run. If desired, you can further refine the search query to filter the search results to suit your needs. Click Go! to run the search again. You can also execute a search in Analyze > Classic Search. For more information, see Running a Search.
You cannot change or add other panels to the Summary page. If you need to display other information, you can create a custom Dashboard as described in Dashboards.
The information displayed on the Summary page is for your local Logger only, and does not include information about peer Loggers even if peers are configured.
Summary Dashboard Panels
- Global Summary: The number of events indexed on your Logger during the time period displayed on the screen. This time period is dependent on the retention policy set on your Logger. The start is the time of the oldest event stored in the Logger since the Logger was restarted, that has not aged out due to retention; the end time is current time. The Add Data (
 ) button at the top opens the Receivers page where you can add and manage the receivers that put log data into your Logger. For more information on managing receivers, see Receivers.
Note: Global Summary and Search page might differ significantly in the amount of events displayed as search time granularity used in both pages is different.
- Event Summary By Receiver: The list of receivers configured on your Logger, the number of events received on each receiver (that are in Logger’s primary storage, not aged out due to retention or archived data), and the timestamp of the last event received on each receiver. If a receiver is deleted, the summary information for it will continue to display until the events received on it age out from Logger’s primary storage. However, the receiver name is changed to the receiver ID (a numerical string) associated with the deleted receiver.
- Event Summary By Device: A device is a named event source, comprising of an IP address (or hostname) and a receiver name. The Devices panel lists devices configured on your Logger, the number of events received on each device (that are in Logger’s primary storage, not aged out due to retention or archived data), and the timestamp of the last event received on each device. If a device is deleted, the summary information for it will continue to display until the events received on it age out from Logger’s primary storage. However, you cannot click the device name to view the events associated with the deleted device.
- Event Summary By Agent Severity: The list of severity levels of the incoming events from ArcSight SmartConnectors to your Logger, the number of events received of each severity level, and the timestamp of the last event received of each severity level. Only events in Logger’s primary storage (not aged out due to retention or archived data) are considered when summarizing this information.
- Event Summary By Agent Type: The list of ArcSight SmartConnectors sending events to your Logger, the number of events received from each SmartConnector (for events that are in Logger’s primary storage, not aged out due to retention or archived data), and the timestamp of the last event received from each SmartConnector. If a SmartConnector is deleted, the summary information for it will continue to display until the events received from it age out from Logger’s primary storage.
The Effect of Search Group Filters on the Summary Page
Search Group filters that enforce privileges on storage groups are applied to the content displayed on the Summary page. However, Search Group filters that enforce privileges on device groups are not applied. Therefore, the Summary page includes counts of events in device groups to which a user does not have privileges. However, if the user tries to drill down to view events, search results in accordance with access privileges are returned as the search query is run on the Analyze page, which enforces all types of Search Group filters. Similarly, if a Search Group filter enforces privileges on both, storage groups and device groups, only the storage group enforcement is applied on the Summary page.
 See Also