Sample Session
The sample sessions are broken out into three parts: one to add the demo sampling tables to your XDB database TUTORIAL location, one to perform data inventory, and one to perform the actual sampling.
Note: Sessions in this tutorial must be done in order.
Database Preparation for Sampling Exercises
In this session, you prepare your sampling data by adding tables to your XDB database TUTORIAL location, which is necessary to complete the sampling exercises.
- From a MS-DOS prompt, type:
 cd
		  InstallationDirectory\mfsql\bin
where InstallationDirectory specifies the directory where Data Express 4.0 is installed, for example, c:\Program Files\Micro Focus\Data Express 4.0.
- Load the data by executing the following command:
xwiz40n /b sampling.sql
- Once the command has finished running, continue to the next section.
Data Inventory
In this session, you prepare your Data Express environment for the sampling data stores and add metadata for the sampling data stores into the Knowledge Base:
- Set your sampling workspace
- Load data store information into the Knowledge Base
Setting Your Sampling Workspace
Data Builder lets you set your workspace as part of the Data Inventory process. You must specify your workspace to organize and sort data on the basis of a logical model:
- From Data Builder, open the
Work with Companies window (click
 or access it through
Environment >
Work with Companies) to create a new company code.
Note: Notice that the Machine IDALLIE is listed with the DXPROJ Company Code in the List of Companies. You created ALLIE during the tutorial Data Inventory. For the purpose of this tutorial, you create a new company under the ALLIE Machine ID. If for some reason you did not perform the Data Inventory tutorial, you must create a Machine ID prior to performing this step.
or access it through
Environment >
Work with Companies) to create a new company code.
Note: Notice that the Machine IDALLIE is listed with the DXPROJ Company Code in the List of Companies. You created ALLIE during the tutorial Data Inventory. For the purpose of this tutorial, you create a new company under the ALLIE Machine ID. If for some reason you did not perform the Data Inventory tutorial, you must create a Machine ID prior to performing this step. - Click New.
- Select the ALLIE Machine ID.
- Specify
SAMPLING as the name of your company
code in the Company Code box.
- In the Company Description box, type: SAMPLING EXERCISE.
- By default, the Life Cycle is activated. Leave this box selected.
- By default, the
Is a Backup Company checkbox is not selected. Leave this box unselected.
During the definition of a company, the backup company associated with it can also be defined.
A Backup Company is useful when all the information concerning the files that undergo the Life Cycle procedure needs to be preserved.
Note: Only one version for each file is stored in the backup company. - Click Apply. The company you just created appears in the List of Companies.
-
Click OK to save your specification and to close the window.
-
Continue to the next section.
Loading Data Store Information into the Knowledge Base
Perform this procedure to map and load the definitions from your data stores into the XDB Knowledge Base. The information from your data stores will be mapped to your workspace.
Load data store information into the Knowledge Base:
- Open the
Distributed Loader window by clicking
 .
.
- Select the Machine ID ALLIE and the Company SAMPLING.
- For this tutorial, leave the load option Skip selected.
- In the Source database list, select GSDEMO.
- In the Schema box, type: SAMPLING.
- In the User name box, type: install.
- In the
Password box, type:
1.
Note: This is the number one.
- Click Preview Tables to view all the available tables in the source database.
- Click Load to begin the export of the metadata into the Knowledge Base.
- Click
Yes.
An Insert tables window appears, followed by an Information window. After the metadata has fully loaded, an Information window appears that displays data store information including the number of data stores.
- Click OK.
- 12. Click Yes to display the log file in a text format.
- 13. Close the notepad view of the log file.
- 14. Click Close to close the Distributed Loader. The list of data stores in the [Work with Data Stores] window is updated automatically.
- 15. Keep Data Builder open, and continue to the next section.
Data Element Sampling
The data for this session is actually located in an XDB database that resides on the Windows machine where you are running your Data Express client software. Typically when this is the case, you would simply execute sampling by clicking Start in the Distributed Sampler window; there is no need to export sampling configuration, execute sampling, and import results.
In this session however, sampling is executed in a similar fashion as it would be in a UNIX environment. Therefore, sampling configuration must be exported, sampling executed, and results imported.
In this session, you:
- Set and export sampling configuration
- Execute sampling
- Import sampling results
- Verify results
- Associate a fingerprint to a class
- Associate a class to data elements
Setting and Exporting Sampling Configuration
Perform this procedure to verify your sampling configuration settings and to export information about the data store to output files.
- In the List of Data Stores in the Work with Data Stores window, select a row for a SAMPLING.TableName data store.
- Right-click and select
Enable Sampling.
Enabling sampling changes the classification number value for the data store to a 1.
Classification numbers are used to restrict the data stores that get sampled. By default, all data stores are assigned a Classification number of 0, which means that sampling is disabled. When sampling the data stores within your work environment, all enabled data stores with Classification number values of 1 will be sampled.
- Repeat steps 1-2 for each SAMPLING.TableName data store.
- In the List of Data Stores, select a data store with the Machine ID ALLIE and the company SAMPLING, right-click, and then click Data Store Properties:
- Note that the
Classification number value is a
1.
Classification numbers can be changed in the Properties window to provide further granularity in restricting which data stores get sampled as based on user-defined criteria. The data store remains enabled as long as the Classification number is not 0.However, just because sampling is enabled does not mean that the data store is a candidate for sampling as this is controlled by Classification number in the Distributed Sampler.
If the Classification number set for the data store is less than or equal to the Classification number specified in the Distributed Sampler, the data store will be sampled. Likewise, if the data store Classification number is greater than the Classification number in the Distributed Sampler, the data store will not be sampled.
Tip: You can assign classification numbers to your data stores based on how often you want to sample data. For example, 1 could represent daily sampling, 2 could represent weekly sampling, and 3 could represent monthly sampling.
- Open the
Distributed Sampler window by clicking
 .
.
- Select the ALLIE Machine ID if it is not already selected.
- Select the SAMPLING company code.
- Retain all default sampling options.
For this exercise, all data stores should be sampling candidates and all sampling options should be utilized.
The following list describes the sampling Options:- Compressed sampling - Produces the data element fingerprint. The fingerprint graphically shows the distribution of values within a given range for the sampled data element. The fingerprints for numeric and alphanumeric data elements differ in that the fingerprint for an alphanumeric data element shows the distribution of values based on the first character and provides additional information.
- Standard sampling - Displays information for each data element value including the number of times each value occurred and the percentage that value represents in the total population.
- Min/Max calculation - Displays the minimum and maximum values for the data element.
- Note the
Output directory specified. By default, this is the directory path to your
config subdirectory, which is located in the
data directory appropriate to the ODBC Extension.
Notes:
- By default, the directory path to the config subdirectory is listed for the ODBC Extension. If you are using the Oracle Extension, this must be changed.
- You can change the Output directory to any directory; just make sure that the files sampling.dat and method.rc are copied to the appropriate config directory prior to executing sampling.
- Click Advanced.
- Retain all default values.
Note: The Data Element Size of 0 (zero) means to include all sizes in the sampling results and does not actually reflect the value of 0 when Ignore Special Values Zero / Space is checked. Likewise, the default 0 values in Max. And Min. Recalculation Additional Options mean to consider all values to be in-range and does not reflect the value of 0.
- Click OK to return to the Distributed Sampler window.
- Click Export:
- Click
OK.
Two output files have been created and are located in the output directory on your Windows machine:
- sampling.dat - contains information regarding the data elements to be sampled
- method.rc - contains encrypted connectivity information about the source data store (data store name, username, and password)
- Verify that the files
sampling.dat and
method.rc are located in the
config subdirectory.
Important: Under normal circumstances, you would need to copy the files sampling.dat and method.rc to the config subdirectory on the machine where your source data store is located. However, in this exercise the files are already in the correct location.
- Continue to the next section.
Executing Sampling
During sampling execution, the Extension Technology uses the output files sampling.dat and method.rc to produce the sampling.log file that contains the resulting statistics.
- From a MS-DOS prompt, change to the Extension Technology executables directory. For example, change to
c:\Program Files\Micro Focus\Data Express 4.0\ODBC.
Note: For more information about directories, see Extension Technology Directories.
- Type dxesampling.
- Change to the log directory.
Note: For more information, see section Executables in Extension Technology Directories.
- Verify that the sampling.log file is listed.
- Continue to the next section.
Loading Sampling Results
The sampling.log file that was generated during sampling execution must be loaded into the Knowledge Base.
- Open the
Distributed Sampler window by clicking
.
- Verify that the Machine ID selected is ALLIE.
- In the Company list, click SAMPLING.
- Click the Load results from file tab.
- Click
 and browse for the
sampling.log file that was generated during sampling execution.
and browse for the
sampling.log file that was generated during sampling execution.
- Click Load.
- Continue to the next section
Verifying Results
Once you have exported sampling configuration information, executed sampling, and loaded the results into the Knowledge Base, you can view the results.
When compressed sampling is performed, a fingerprint is created. The fingerprint is a unique graphical representation of the distribution of data for the sampled data element. When the results for compressed sampling are loaded, the fingerprint is created.
- In Data Builder, click the Sampling tab:
- Select the row for the SAMPLING.TABADD data store name in the List of data stores - Sampling Active list.
- Click
 (Show Synthetic Data Elements) or right-click and then select
Show Synthetic Data Element Contents.
(Show Synthetic Data Elements) or right-click and then select
Show Synthetic Data Element Contents.
The Data Store Data Elements list in the left pane shows the data elements for the data store you selected.
- In the
Data Store Data Elements list, select the data element
PRGADDR.
You can also select the image for the data element in the Data Element Samples grid. To ensure that you have selected the correct one, the related data element name is highlighted in the Data Store Data Elements list.
Sampling results for the numeric data element PRGADDR are displayed.
- Review the data element fingerprint in the
Zoomed Data Element Sample. The fingerprint is the result of performing compressed sampling.
Notice the following:
- The numbers on the vertical y-axes represent the ranges of values based on the decimal place, where each number represents one decimal place to the left of the decimal point. For instance, 0 represents the ones place (0-9), 1 represents the tens place (10-99), 2 represents the hundreds place (100-999), and so on.
- The numbers on the horizontal x-axes represent a specific range based on the corresponding y-coordinate. For instance, 1 represents the value 1 for the y-coordinate 0, while 1 represents values 10-19 for the y-coordinate 1.
- The values in each cell indicate the number of times a value in the data element falls within the specified range.
Note: The fingerprint can also be viewed as a bar graph by clicking Graph. - Review the items in the list
Sample Analysis of the Selected Data Element. This list shows the actual data element values when standard sampling was performed.
Known Restriction: Currently Data Express only shows the first 1000 distinct values and ranges, which are sorted either numerically or alphanumerically based on the data element type. When there are more than 1000 distinct data element values, the Data Element Value ends at the 1000th unique value instead of the greatest data element value.
- In the
Data Store Data Elements list, select the data element
ADDRESS.
Sampling results for alphanumeric data element ADDRESS are displayed.
Review the data element fingerprint in the Zoomed Data Element Sample. The fingerprint is the result of performing compressed sampling.
Notice that the fingerprint for an alphanumeric data element contains four distinct sections:Section Type Example Description Character
Distribution
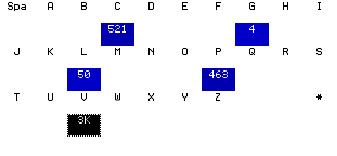
A range of characters in alphabetical order is provided to show how many data elements begin with that character.
Number
Distribution
A range of numbers is provided to show how many data elements begin with the indicated number. In the provided example, no data elements begin with numbers.
Type Summary
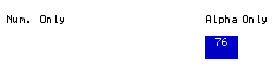
An alphanumeric data element can actually be a numeric-only data element or alphanumeric data element. The type summary provides a count of how many data elements fall into either category. In the provided example, all data elements are alphanumeric in type.
Field Length
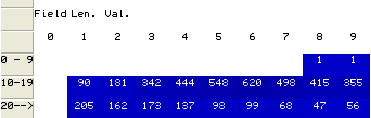
The numbers on the vertical y-axes represent the ranges of values specified. The numbers on the horizontal x-axes represent the position of the actual number in that range. For instance, 90 in the provided example means that there are 90 values with a length equal to 11. Note: The fingerprint can also be viewed as a bar graph by clicking Graph. - Close the Show Synthetic Data Element Contents window to return to Work with Data Stores.
- Open the
Work with Data Elements window (click
 or access it through
Environment >
Work with Data Elements).
or access it through
Environment >
Work with Data Elements).
- In the Machine ID list, click ALLIE.
- In the Company name list, click SAMPLING.
- Click
Apply Filter.
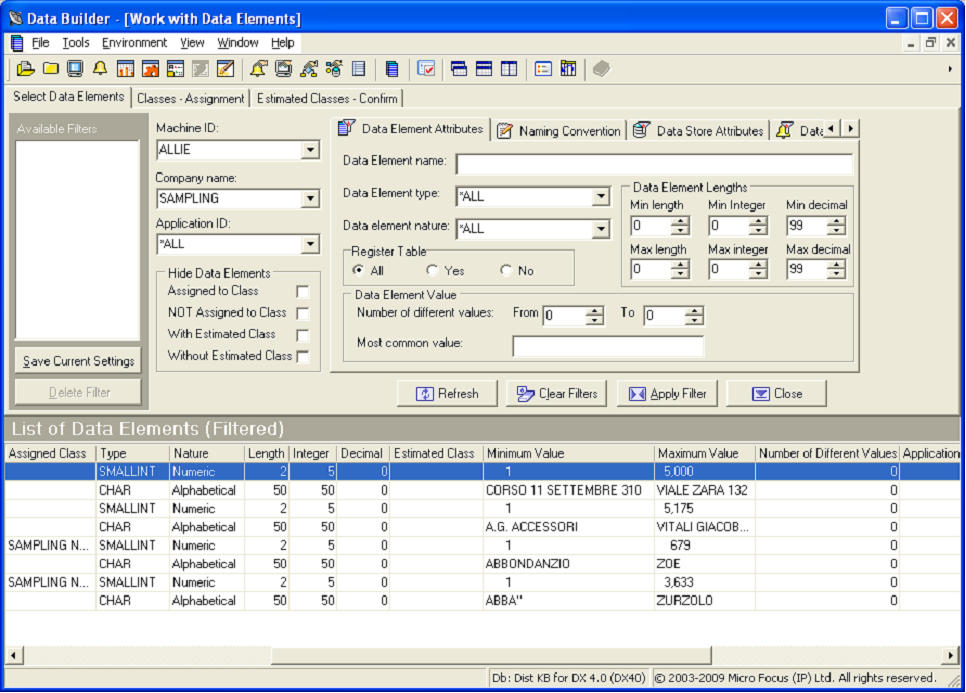
- Note the Minimum Value and Maximum Value items in the List of Data Elements, which are the result of performing min/max calculation sampling.
- Leave the Work with Data Elements window open, and continue to the next section.
Creating a Sampling Class
You can create a new class to be used for sampling purposes, or you can use a predefined class. In this exercise you will create a sampling class named SAMPNUM.
- Open the
Work with Classes window (click
 or access it through
Environment >
Work with Classes).
or access it through
Environment >
Work with Classes).
- Click New.
- In the Name box, specify SAMPNUM as the name of the class you want to create.
- In the
Full description field, specify
SAMPLING NUMERIC VALUES as the description of the class.
Note: The description will be visible as a label when you assign the class to data elements within data stores.
- Select the Super Class Numbers.
- Select the data type Numeric.
- Leave the remainder of the fields at their default values. Click
Apply.
The class SAMPNUM is now listed in the List of Classes.
- Click OK to return to the Work with Data Elements window.
- Click Refresh.
- Continue to the next section.
Associating a Fingerprint to a Class
In Data Express, you can correlate data elements if their value distributions are similar. To do this, you must first associate a fingerprint, which represents the desired distribution, to a class.
This fingerprint becomes the prototype that is used determine the class assignment for other data elements. If the prototype and the fingerprint for a data element are deemed similar based on a calculated confidence value, the data element is also associated with the prototype class.
- Click the Classes - Assignments tab.
- In the All Classes pane, expand the Number Super Class, and select the class description SAMPLING NUMERIC VALUES.
- In the List of Data Elements, select the row for the data element PRGNAME in the data store TABFNAM.
- Check the Selected Data Element Attributes check box:
- Drag the fingerprint that now appears beneath the text
Selected Data Element Attributes, to the first
Class Samples cell.
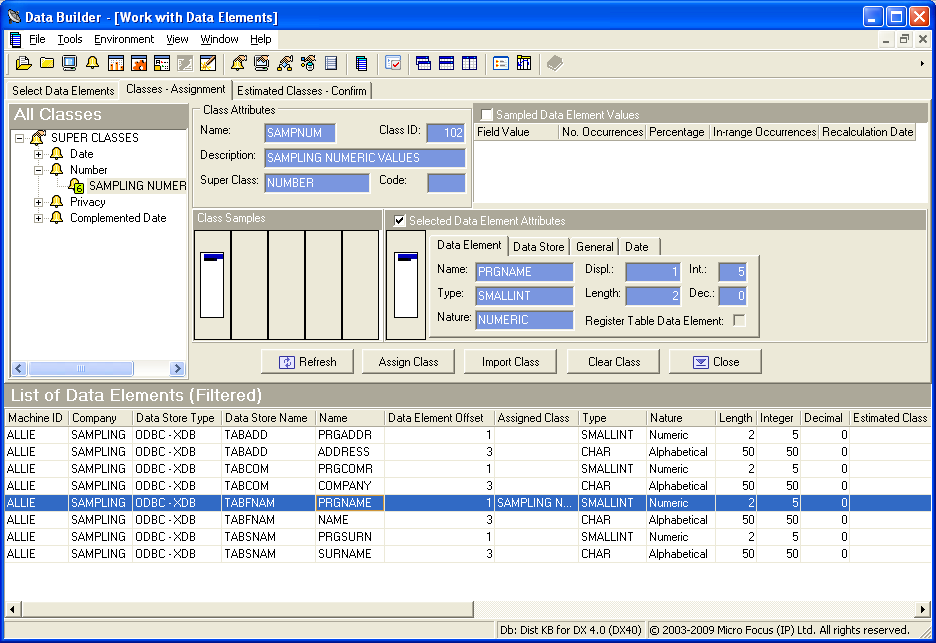
By highlighting the SAMPNUM class description in the All Classes pane and then by dragging the fingerprint for the PRGNAME data element to the Class Samples cell, the SAMPNUM class is then assigned to the fingerprint. This fingerprint becomes the prototype. This action also associates the SAMPNUM class to the PRGNAME data element.
- Continue to the next section.
Associating a Class to Data Elements
In this exercise you are associating the class SAMPNUM (which is associated to your sampling prototype) to other data elements with sampling data distributions similar to the prototype fingerprint.
The level of similarity between distributions depends on the thresholds you set when importing the class information. If the prototype and the fingerprint for a data element are deemed similar based on a calculated confidence value, the data element is also associated with the prototype class.
- From the Work with Data Elements window, click Import Class. The Import Class window is displayed.
- Click
Sampling Results.
When comparing the fingerprint for a data element to the prototype fingerprint, internal Data Express confidence values are calculated to provide measurements that illustrates the similarities between the data distributions. The internal confidence values are used as input for the threshold formulas.
- In the Machine ID list, click ALLIE.
- In the Company list, click SAMPLING.
- In the Super Classes section, click Numbers.
- Set the
Theshold 1 value to
82.
The value for Threshold 1 represents a percentage where the similar areas in the two fingerprints are weighted more heavily than the dissimilar areas.
- Keep the logical operator set to AND.
- Set the
Theshold 2 value to75.
The value for Threshold 2 represents a percentage where all areas (both similar and dissimilar) in the two fingerprints are given equal weight.
- Click Import:
- Click OK.
- Close the Import Class window and return to the Work with Data Elements window:
- Click the
Close button to close the
Work with Data Elements window.
A sampling class has successfully been assigned to data elements with similar distributions to the prototype.
- Close Data Builder; either Click
File >
Exit or click the
 button, and then click
Yes.
button, and then click
Yes.