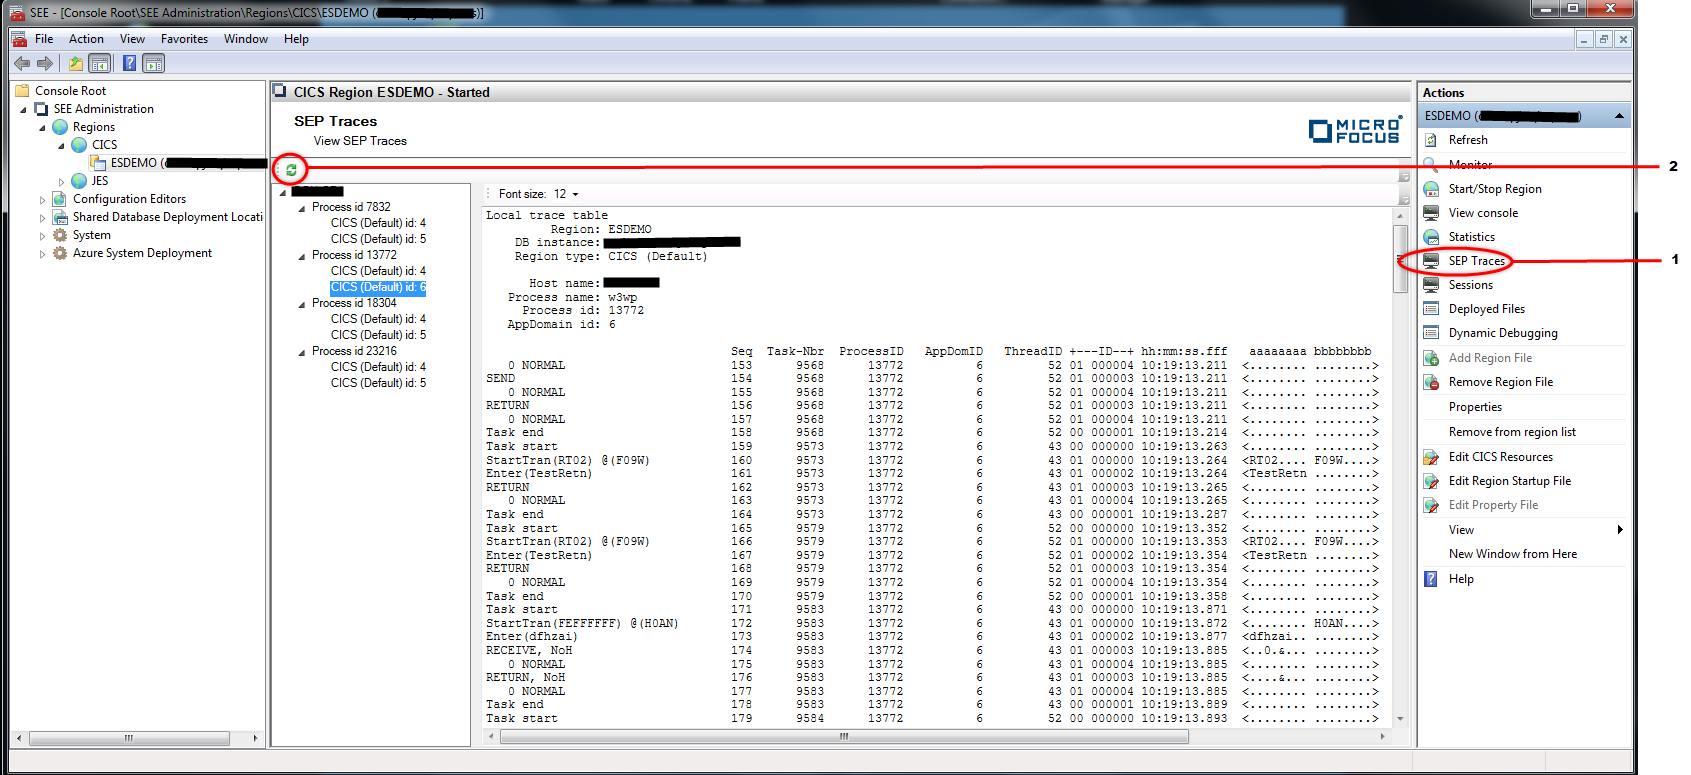
To View Local Trace Tables from the SEP Traces View
Select a running region from within the
Enterprise Server for .NET Administration UI and click on
SEP Traces in the Action pane. See
1 in the diagram below.
The
SEP Traces view is displayed. A tree in the left-hand side of the Results pane displays the machines, processes and SEPs which have local trace tables for the running region.
Select one of the SEP instances.
The trace table associated with that SEP is displayed in the right-hand side of the
Results pane.
The tree of SEPs and trace table contents can be refreshed by clicking on the Refresh button. See
2 in the diagram below.