Debug MFDEMO
Debugging requires that your project is associated with the IMSDEMO enterprise server and that IMSDEMO is configured to use dynamic debugging. Both of these requirements were met earlier in this tutorial.
Set Breakpoints
- In the Application Explorer view, expand the IMSTutorial project; then double-click DEMO001T.cbl to start the COBOL editor.
- Scroll down to line number 551 and set a breakpoint. The code on line 551 is:
IF DEMO91-FUNCTION = 'I' OR 'i'
Note:- To enable line numbers in the editor, click Window > Preferences, expand General > Editors. On the Test Editors page, check Show line numbers and click OK.
- To set a breakpoint, on the line of code where you want to break, put your cursor in the far left column and double-click.
Set Debug Properties
- In the Application Explorer view, right-click DEMO001T.cbl; then select Properties.
- In the left pane, click COBOL.
- In the right pane, check Enable file specific settings.
- Check Compile for debugging; then click OK.
Create a Debug Launch Configuration
- In the Application Explorer view, click the IMSTutorial project to select it.
- From the main menu, click Run > Debug Configurations.
- On the tree view, click COBOL Application.
- On the Debug Configurations toolbar, click
New launch configuration
 .
.
- In the Name field, type COBOL_IMS_Tutorial.
- On the General tab, expand Main Program.
- If checked, uncheck Program is part of project build configuration.
- Click the Browse button under Main Program.
- Browse to and select the DEMO001T.dll file located in your project's loadlib folder.
- Click Apply and then Close to apply changes and close the Debug Configurations dialog box.
Start Debugging
- From the Eclipse menu, click
Run > Debug As > IMS on COBOL Enterprise Server.
Enterprise Developer:
- Builds the project.
- If stopped, starts the IMSDEMO enterprise server region. If prompted, click OK.
- Opens the debugger.
- In Server Explorer, right-click
IMSDEMO; then select
Show TN3270 Display.
Note: If the Rumba Mainframe Display view does not connect automatically, click
 (Connect) in the
Rumba Mainframe Display view.
(Connect) in the
Rumba Mainframe Display view.
- In the terminal emulator, log into IMS and start MFDEMO just as you did to run the MFDEMO application as described in the
previous topic.
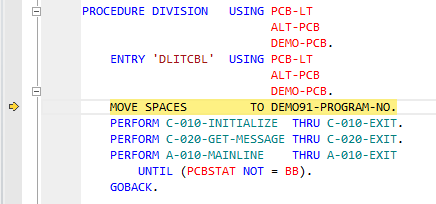
In Enterprise Developer, the debugger shows the current line of code execution:
- On the
Enterprise Developer toolbar, click
 (Resume).
This transfers control back to the terminal emulator and advances the application to its main menu.
- On the main menu in the terminal emulator, type
I into the
FUNCTION CODE field to select the <I>NQUIRE function.
This action advances your cursor to the TABLE-ID field.
- In the
TABLE-ID field, type
TESTDEPT; then press
Enter.
The application advances to the details screen and shows the contents of the TESTDEPT table.
- On the
Enterprise Developer toolbar, click
(Resume).
The debugger advances to your breakpoint. From here you can continue debugging if desired. When you have finished, continue with the next step from whatever screen you are on.
- Tab to the RETURN field.
- Type X; then press Enter.
- On the main menu, type
E into the
FUNCTION CODE field; then press
Enter.
This action takes you to the TRANCODE - MFDEMO - ENDED screen.
Stop Debugging
- From the Rumba
Mainframe TN3270 Display toolbar, click
 (Disconnect); then close Rumba.
- In
Enterprise Developer, click
 (Terminate).