Troubleshooting Scenarios using Third-party Tools
Third-party diagnostic tooling can be incredibly useful in tracking down the cause of issues within Micro Focus software.
Scenario 1: Core file not generated
One particularly useful tool in Windows environments is the Process Monitor (ProcMon) application. The Process Monitor is part of the Windows SysInternals suite of tools, which you can download from the Microsoft Web site.
ProcMon shows path and registry accesses and searches that have been performed across your system. You can view all accesses and searches, or filter them to show specific information. The following example illustrates a problem in generating a core file, and how you can use ProcMon to troubleshoot the problem.
- Problem
- In the cobconfig.cfg file, you set the core_on_error and core_filename run-time tunables to generate a core file named MFCore.pid@time_date in the c:\logs directory when the application crashes; however, when you application does crash, it appears that no core file was generated.
- Troubleshoot with ProcMon
- The ProcMan application runs concurrently with your application to trace its activity based on filters you set. You could
use the following procedure to troubleshoot the core file generation problem:
- Start ProcMon, and set a filter to trace all references to paths that contain the string
MFCore:
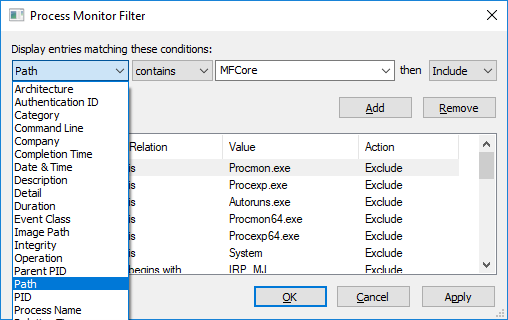
- Re-run the application such that it crashes.
- View the output in ProcMon.
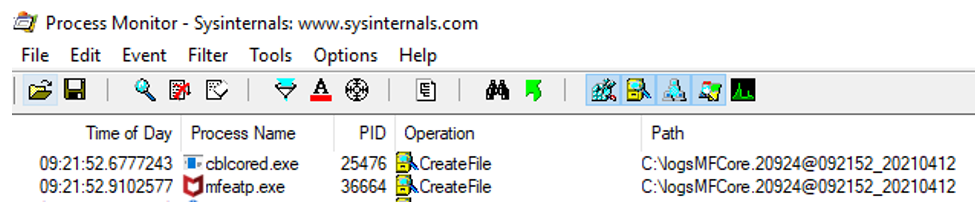
In this example, the ProcMon output indicates that the run-time tunables you set caused a file named logsMFCore... to be created on the root directory of your C: drive instead of a file named MFCore... in the C:\logs directory. This is an indication that there is an error in how you defined the core_filename run-time tunable.
- Edit the
cobconfig.cfg file, which shows:
set core_on_error=131
set core_filename="C:\\logs\MFCore.%p@%t_%d"
Upon inspection, you see that the value set for core_filename has only one backslash (\) between the logs directory specification, and the filename specification.
Because backslash characters in the cobconfig.cfg file are escaped, this single backslash was removed, causing the file to be located in the wrong place.
- Add a second backslash after the directory specification in the value of
core_filename as follows:
set core_filename="C:\\logs\\MFCore.%p@%t_%d"
- Save and exit the editor.
- Re-run the application. The core file should now appear in the correct location when the application crashes.
- Start ProcMon, and set a filter to trace all references to paths that contain the string
MFCore:
Scenario 2: Unable to connect to a UNIX fileshare server from a Windows machine
- Problem
- After setting up a Windows machine as a fileshare client and defining a remote connection using port 8765 to a remote fileshare server running Redhat Linux, the connection to the fileshare server does not work.
- Troubleshooting with ncat
- The first thing to check in a scenario like this is the network connection to the Windows machine. For this, you can use
ncat, available from
NCAT.ORG) to setup a very basic client/server connection. If the ncat connection works, then you can rule out network issues as being
the culprit. In this scenario, you could execute the following ncat commands:
- On the UNIX machine, to establish network connectivity:
ncat -l localhost 2000
- On the Windows machine, to establish network connectivity to the UNIX machine:
ncat host-name 2000
where host-name is the name of the UNIX fileshare server.
In this scenario, the connection was established successfully for both. The next step is to investigate what is happening within the connection itself.
- On the UNIX machine, to establish network connectivity:
- Troubleshooting with Wireshark and tcpdup
- You can use a combination of tcpdump and Wireshark to analyze the traffic going over the network. These are both useful and
powerful tools for analyzing many types of network issues.
Running Wireshark on the Windows (client) machine, shows that although we sent , we never received a response. This suggests some kind of issue on the Redhat (server) side. To troubleshoot this:
- Start Wireshark on the Windows (client) machine.
- Set a filter to show connections to the IP address of the server machine.
- Send a tcp request to port 8765, on which the fileshare server is running.
- View the output.

Here we can see we've sent the request to port 8765, but received no response.
To find out what is happening on the Redhat (server) side, we can use tcpdump, which is a similar tool to Wireshark but for Unix/Linux systems.
- At a command prompt, run
tcpdump as follows to set a filter that returns just the traffic on fileshare port 8765:
tcpdump -i eth1 'port 8765'
The output of tcpdump shows that this was empty, suggesting that the network request was not received by the Redhat machine.
- Resolution
- Upon further investigation of the environment, we find that the firewall was blocking requests on port numbers greater than 3000. Therefore, because the ncat connection ran on port 2000, it was successful. The Wireshark/tcpdump connection was not successful because the firewall blocked port 8765.