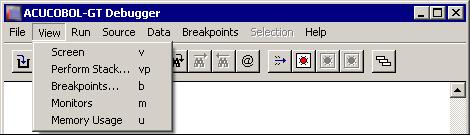
View Menu
The View menu contains commands related to viewing and monitoring your program.
| Menu Option | Description |
|---|---|
| Screen | Displays your application's current screen. Press any key or click the left mouse button to return to the debugger.
The keyboard form of this command is V. |
| Perform Stack | Lists all of the nested paragraphs leading up to the current statement, starting from the beginning of the program (or the
beginning of the thread, if a new thread was started). Double-clicking one of the names in the list takes you to that paragraph
and highlights the current statement in that paragraph. The trace also accounts for embedded procedures and declaratives.
In order to use this command, you must have compiled for source-level debugging (-Gd), and your program must allow for recursive performs (-Zrl). Recursive performs are the default. The keyboard form of this command is VP. |
| Breakpoints | Displays a dialog box that lists all of your breakpoints and allows you to modify them, add new ones, view the next line of
code containing a breakpoint, disable a breakpoint, and clear a breakpoint. It shows the location and skip count for each
breakpoint. For breakpoints that are located in the current program, the paragraph they are contained in is also listed.
The keyboard form of this command is B. |
| Monitors | Shows all monitored variables and their values. It also displays a sequence number for each monitor. You need the sequence
number to clear an individual monitor. See
Data/Monitor/Clear menu option in
Other Commands.
The keyboard form of this command is M. |
| Memory Usage | Displays the amount of dynamically allocated memory currently used by the runtime system. There are five types:
The keyboard form of this command is U. |