
Connect
Data Volume Analysis
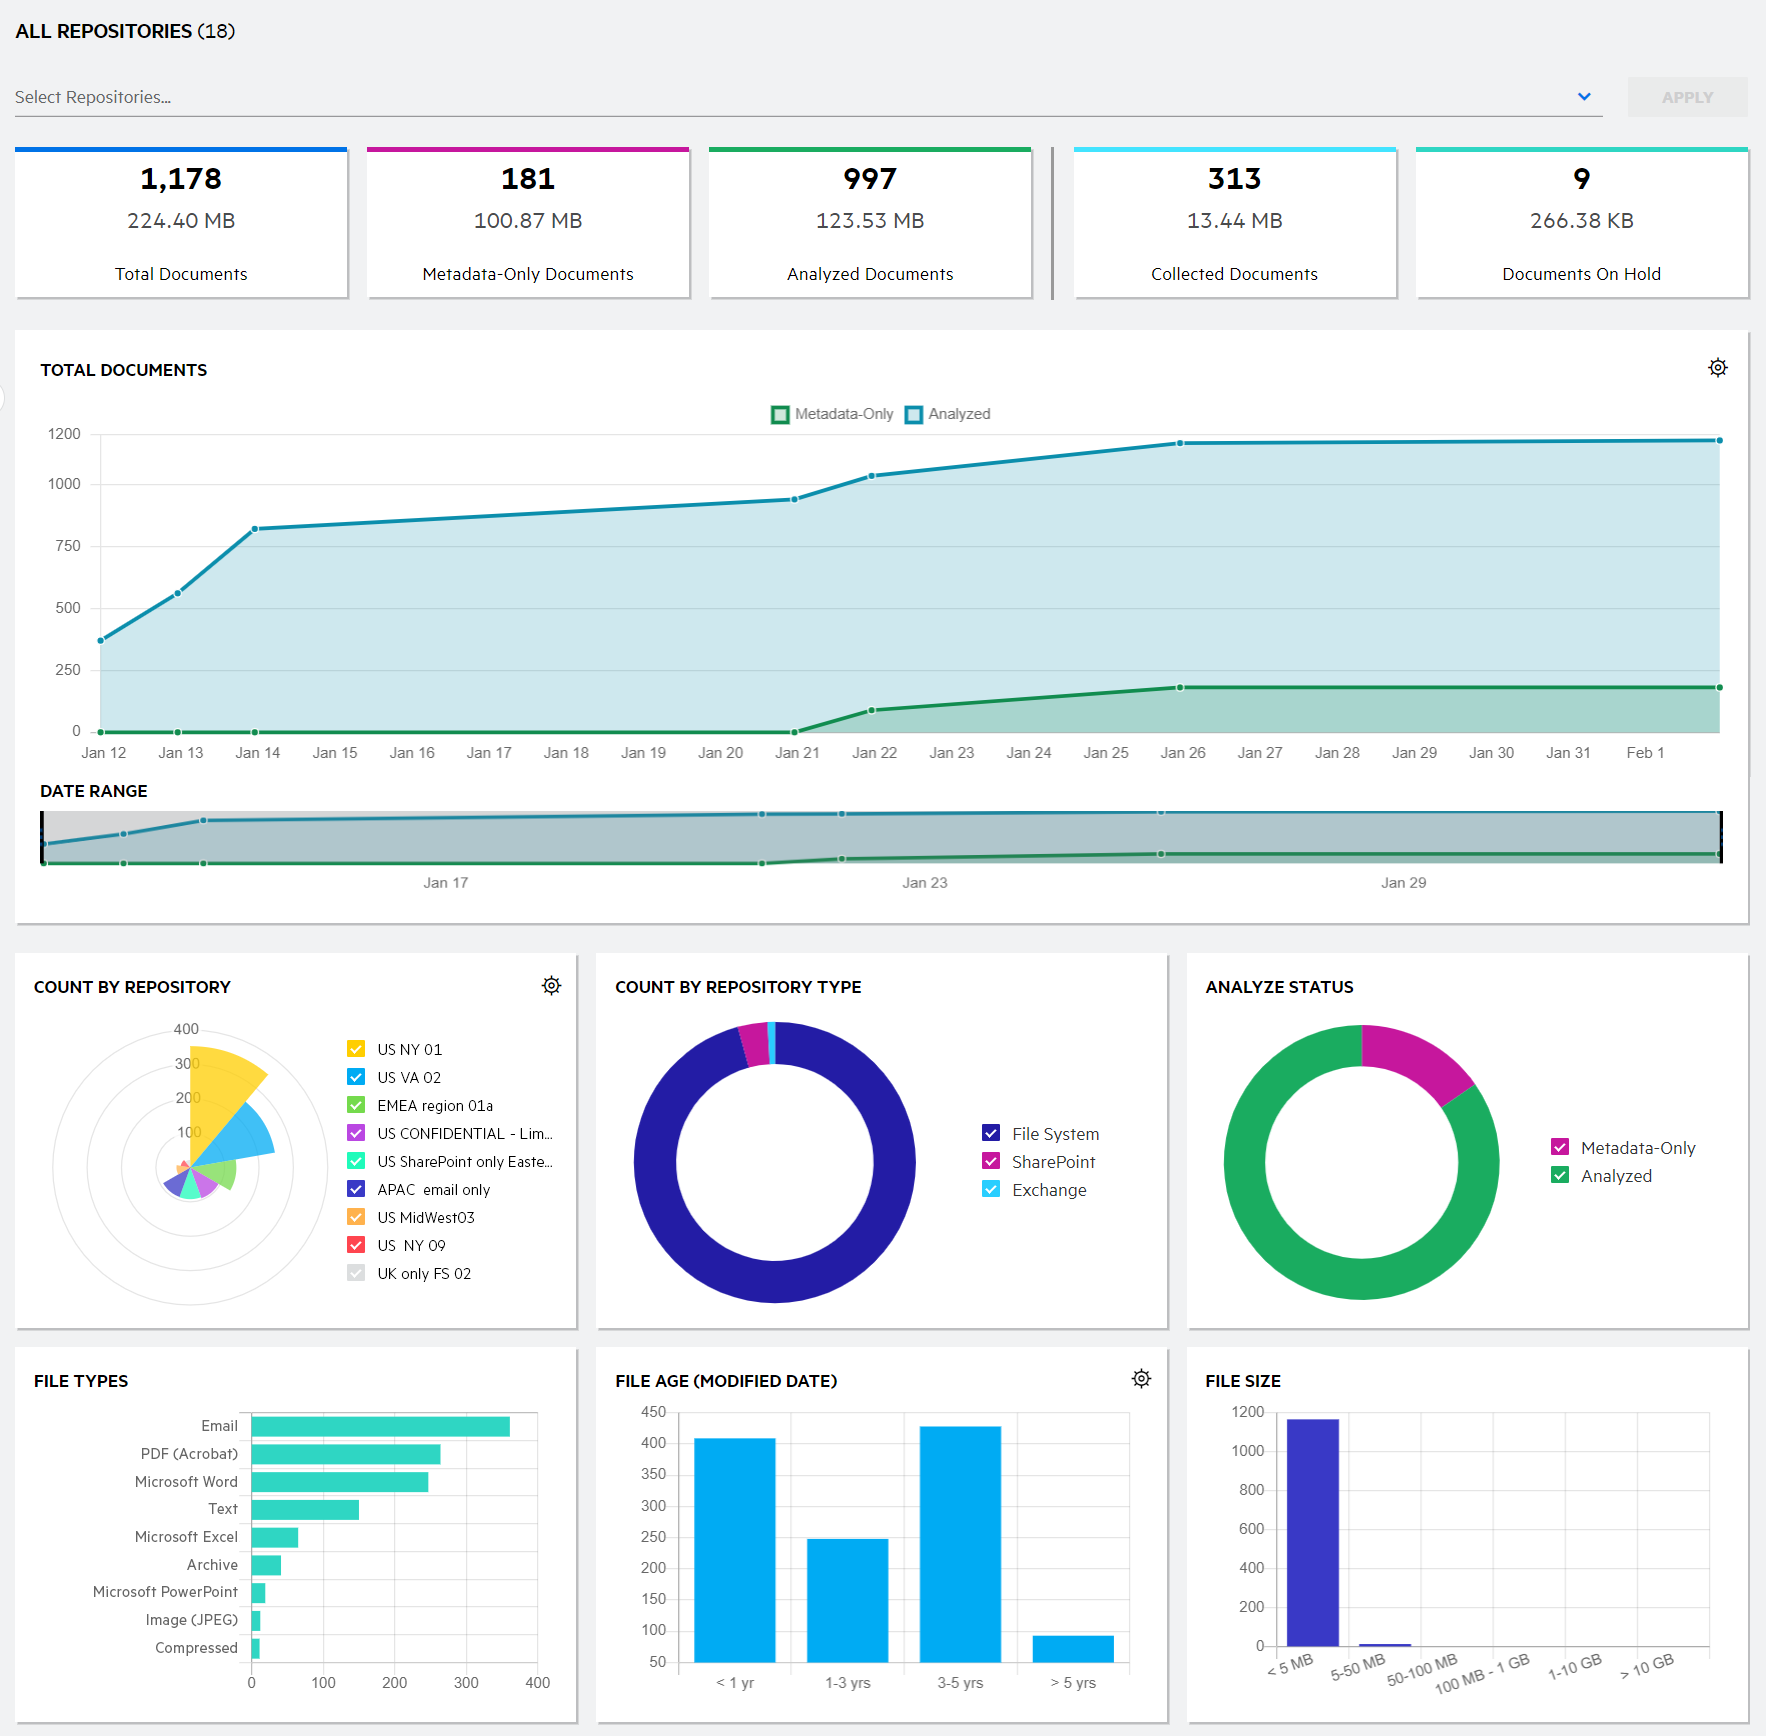
The Data Volume Analysis dashboard depicts the growth of the data under management over time for all repositories. The dashboard lets you keep track of the current data store under management. You can view the data for all repositories or a specific repository. On all charts, hover over a data point or data segment on the chart to view the details.
The Data Volume Analysis dashboard includes the following graphical views as it relates to your data under management, for the selected repositories.
TIP: To select individual repositories, click Select Repositories, click the names of the desired repositories, and then click Apply.
To remove a selected repository from the view, click the X associated with the repository you want to remove.
-
Using the Total Documents card, view the total number of documents managed. This includes documents for which metadata only or metadata and content are processed (indexed only), and documents that are collected (metadata and content indexed, and binary stored). Extracted attachments are not included in the count. Documents within email archives and compressed archives are included in the count only if they were processed as part of the repository's Primary Capture Rules.
-
Using the Metadata-Only Documents card, view the number of documents for which only the metadata has been indexed. The content of these documents has not been indexed and therefore a preview of the document content is not viewable in Analyze.
-
Using the Analyzed Documents card, view the number of documents for which both the metadata and content has been indexed. Extracted attachments are not included in the count. Documents within email archives and compressed archives are included in the count only if they were processed as part of the repository's Primary Capture Rules.
-
Using the Collected Documents card, view the number of documents for which metadata and content have been processed (indexed) and collected (binary stored). Attachments are not included in the count. Documents within email archives and compressed archives are included in the count only if they were processed as part of the repository's Primary Capture Rule.
-
Using the Documents on Hold card, view the number of documents in the index that are currently on hold. Only collected documents can be on hold. Attachments are not included in the count. Documents within email archives and compressed archives are included in the count only if they were processed as part of the repository's Primary Capture Rules.
-
Using the Total Documents chart, view the growth of metadata-only and analyzed documents over time
View the data by document count (default) or by size on disk. Click the settings icon (
 ) and select to view the data by document count or size..
 View the data for a specific timeframe using the date range selector beneath the chart. You can adjust the start and end dates independently, or move the entire timeframe. To adjust the start and end dates, click and drag the control bar on either end; the date displays onscreen as you move the control bars. To move the entire timeframe, click anywhere within the selected timeframe and drag to the desired point in time; the date range displays onscreen as you move the selected timeframe.
-
Using the Count by Repository/Clusters/Repository attributes chart, view the distribution of documents under management relative to repositories or agent clusters, or to a selected repository attribute. Hover over a data segment to view the total number of documents and the percentage relative to total documents. If you are viewing the dashboard for multiple repositories, clusters, or attributes, the top nine are shown; clear the check boxes for those you want to hide from the chart.
By default, the repository information displays. To show details for agent clusters or a specific repository attribute instead, click the settings icon (
) to the top right of this chart and then select Clusters or the desired attribute. The selection you make here is saved as your preference and will display going forward until you make another selection. -
Using the Analyze Status chart, view the number of metadata-only and analyzed documents. Hover over a data segment to view the total number of documents and the percentage relative to total documents.
-
Using the File Types chart, view the distribution of documents across the top nine file types. Hover over a data segment to view the total number of documents and the percentage relative to total documents.
-
Using the File Age Created Date/Modified Date chart, view the distribution of documents over defined time frames. Hover over a data segment to view the total number of documents and the percentage relative to total documents.
By default, file age by created date displays. To show details for file age by modified date, click the settings icon (
) and then select Modified Date. -
Using the File Size chart, view the distribution of documents based on file size. Hover over a data segment to view the total number of documents and the percentage relative to total documents.
TIP: Documents refer to original files processed by File Analysis Suite. Any attachments to these documents are referred to as items. Files within archive files, such as ZIP or PST, are considered as and counted as documents.