Sensitive Trend Analysis
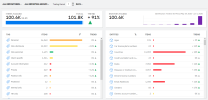
The Sensitive Trend Analysis dashboard depicts the volume of sensitive data under management. Content is identified by the automated tags that are applied as content is processed. You can see the number of items tagged per tag and per entity as well as the trend for the selected time period.
The Sensitive Trend Analysis dashboard includes the following features:
-
View the data for all repositories or an individual repository. When you select to view data for all repositories, you can further refine the view by any tag reporting group in any repository. When you select to view an individual repository, you can refine the view by reporting groups within the selected repository.
-
View the data for all tag reporting groups within the repository selection, or refine the view to a single reporting group.
-
View data for a specific time period using the Trailing Period selection at the top of the dashboard. Define the number of previous days, weeks, months, or years to view data for. The default view is set to seven days (the past 7 days, including the current day).
-
Where applicable, hover over the data in the chart to view additional information.
-
Click a column header, including the chart column, to sort the tag or entity details.
-
Click a tag or entity name to go to the list of items associated with the tag or entity. On the Research document list page, hover over the VIEWING CONTENT OF box above the filter panel to view the criteria for the resulting list of items. For example, if you click a tag name, the document list displays all items for the selected repository, reporting group, tag name.


