Using the Dashboard
NOTE: The following exercises introduce the basic features of the Analytics Tools. Familiarize yourself with these features to become proficient enough with the tools to try more advanced features.
-
Uncheck one or two of the boxes in the Filters region of the Dashboard to observe how the changes are reflected in the Summary Data, Top Extensions by Size, and Summary regions.
-
Click a specific year in the Files Created by Year region to observe the changes in the Summary Data, Top Extensions by Size, and Summary regions of the Dashboard.
These graphical displays are driven by the Filters region and the selected years from the Files Created by Year and Files Modified by Year regions.
-
Move your cursor over a pie graph section in the Summary Data region to observe how specific information about the section appears in a balloon.
-
Double-click a pie graph section and observe how the Dashboard drills down to show data specific to the selected section in the Summary Data, Top Extensions by Size, and Summary regions.
-
Right-click a section of the new pie graph and select Details Grid to view the individual filenames.

-
Right-click a file from the grid and select Open Folder to open the folder where the file is located. The Dashboard provides the ability to access any files easily.
-
Close the grid.
-
Click the drill-up arrow (3) for the Summary Data region of the Dashboard to return to the originally-displayed data.
-
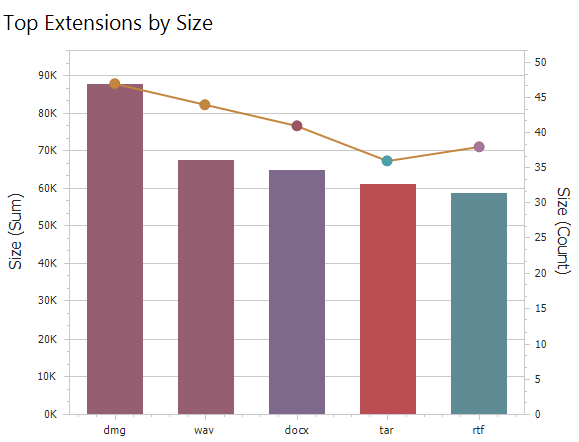
Move your cursor over one of the bars in the Top Extensions by Size region to observe how specific information about the section appears in a balloon.
-
Right-click and select Export to Image in the Top Extensions by Size region.
-
Save the image to a location on your desktop to insert as a graphic in a presentation or report.

-
Double-click a year span in the Files Created by Year region to observe how the displayed data in the other regions is updated to data pertaining to the selected year.
-
Right-click the selected year span and select Clear Master Filter to view the graph span of all the years again.
-
Double-click a year span in the Files Modified by Year region to observe the change in the displayed data in the Dashboard.
-
Move your cursor over a bar in the Top Extensions by Size region, then right-click and select Print Preview. Note that you can save the graph as a PDF or email the graph, in addition to printing it.
-
Close the Print Preview page.