Using the Pivot Grid
Visually analyze data according to combinations of variables in the Pivot Grid.
-
Click Load from Database in the Dashboard.
-
Double-click the desired file system scan.
-
Click Pivot Grid.
-
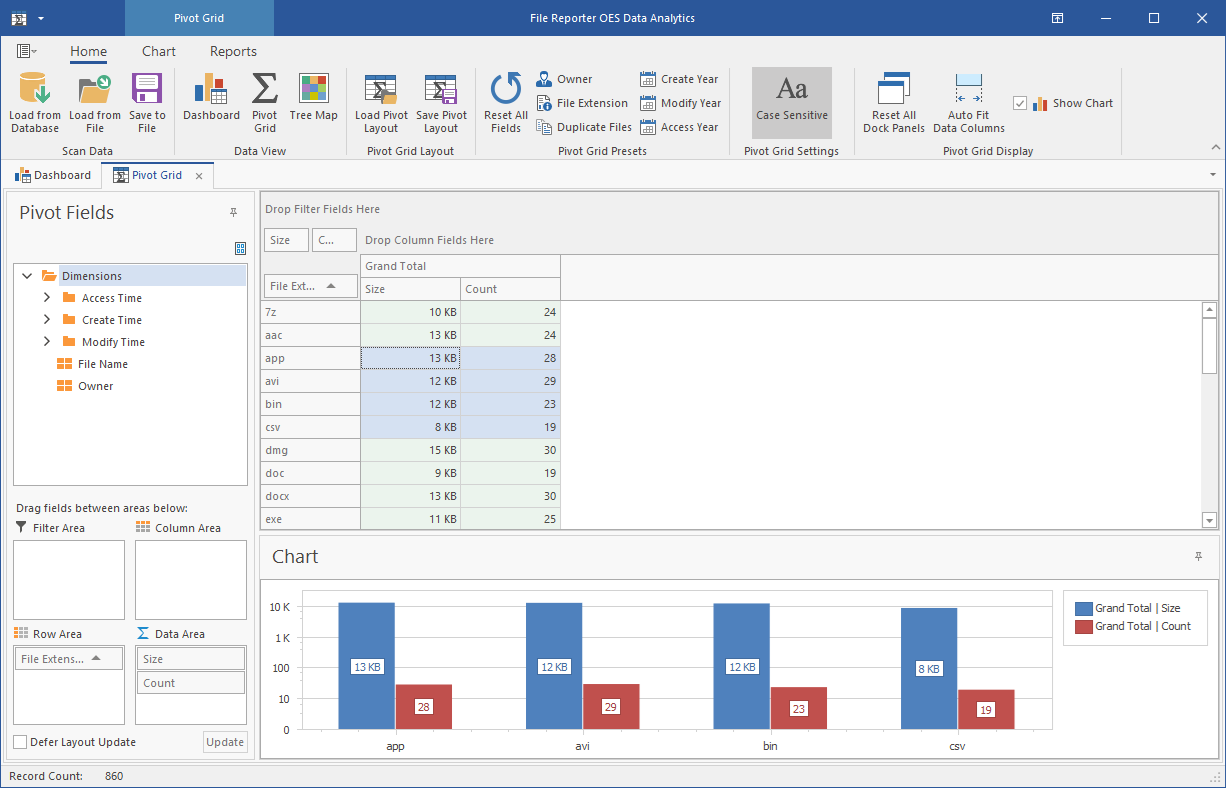
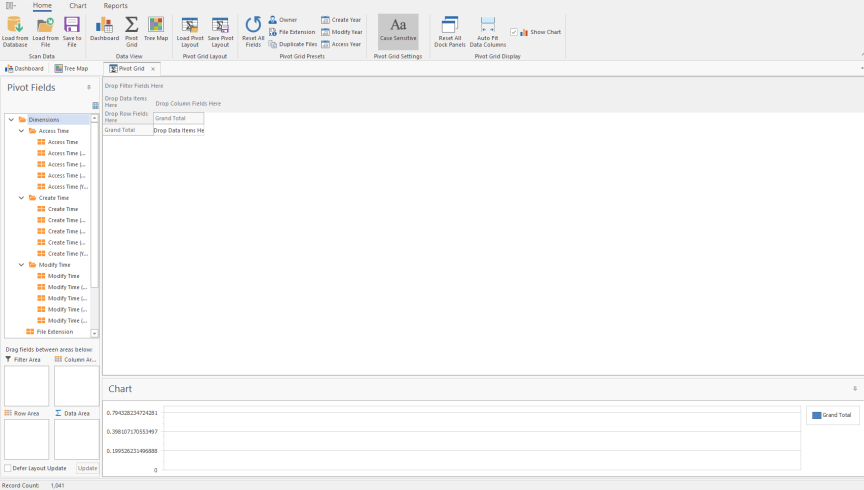
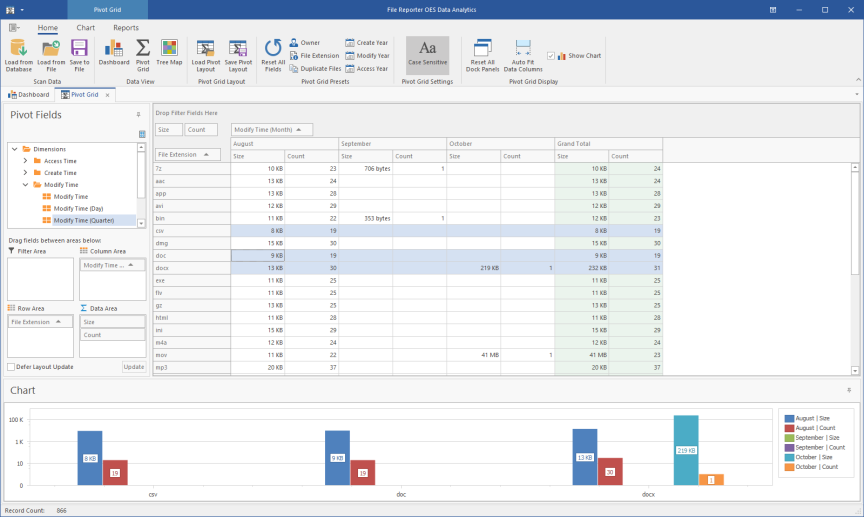
Select Size and Count (residing in the Measures folder) from the Pivot Fields region and drag them to the area marked Drop Data Items.
-
Again in the Pivot Fields region, select File Extension and drag it to the area marked Drop Row Fields Here.
-
Observe the totals now calculated for the data variables.

-
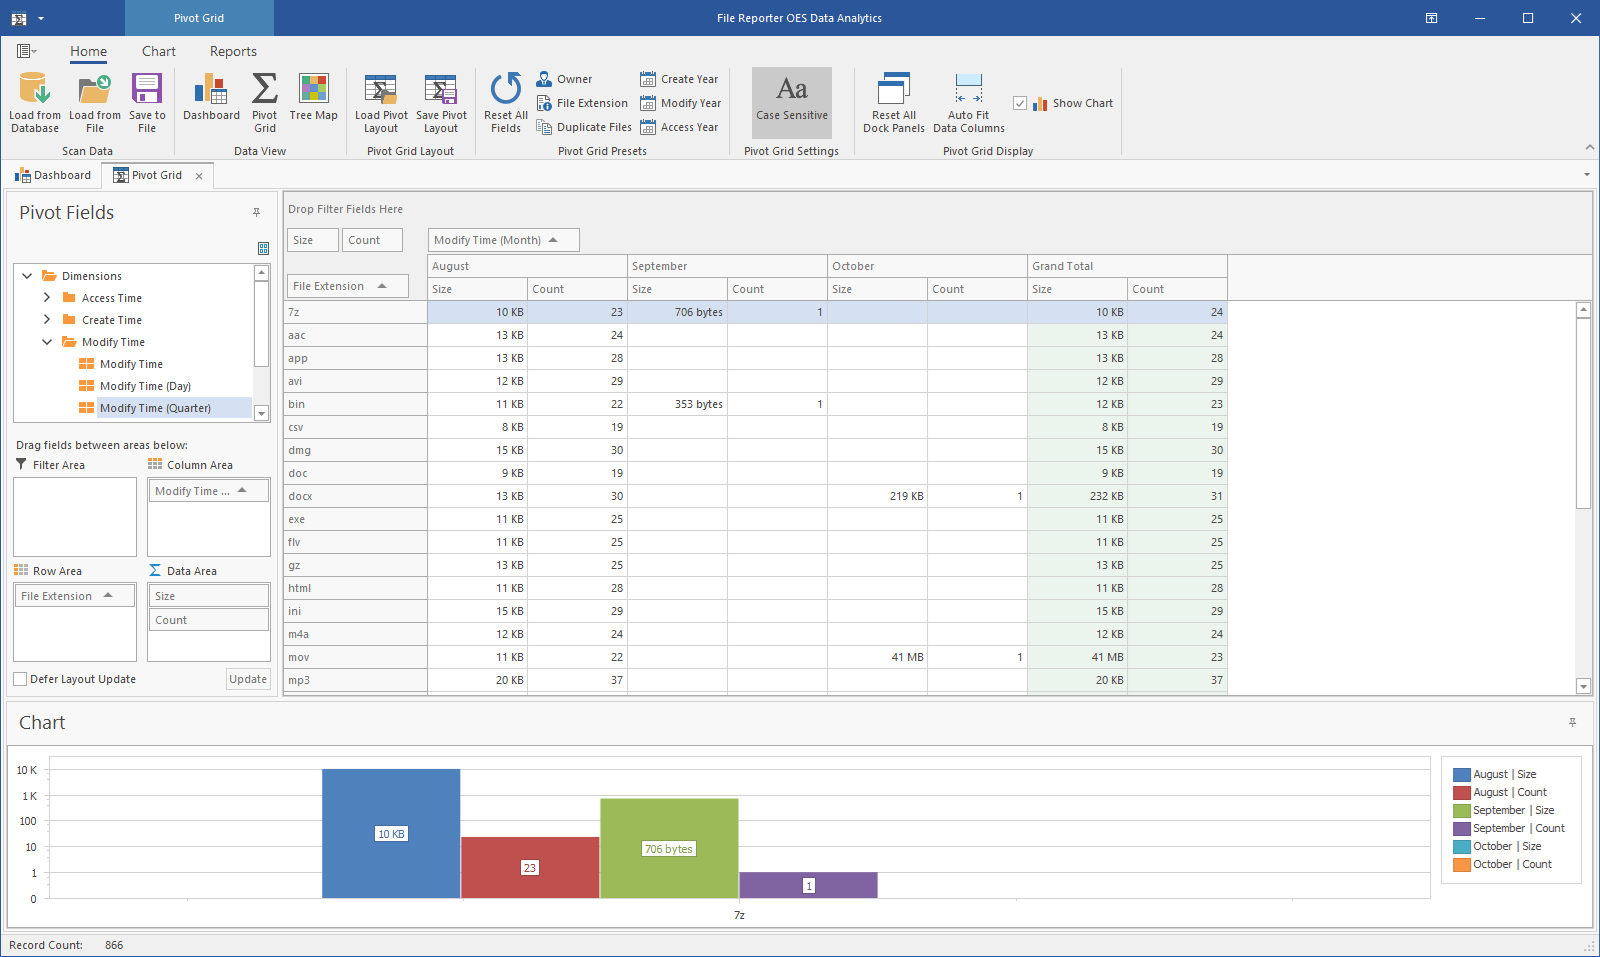
Expand Access Time to locate Modify Time (Month) in the Pivot Fields region and drag it to the area marked Drop Column Fields Here.

-
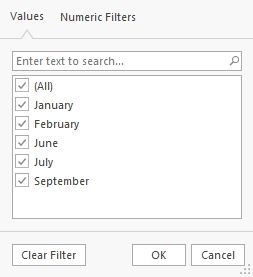
Click the filter icon from the Access Time (Month) filter that you just placed.
-
Deselect all but one month and click OK.
-
Click the Chart tab.
-
Highlight three consecutive rows to view the data analyzed as graphs in the Chart region.
-
Experiment with different chart views of the data using the Chart Presets options.
-
Double-click a selected cell from the table to access the Scan Data Details table, which specifies all files accessed by that user during that month.
-
Right-click a file From the Scan Data Details table, and select Open Folder to open the parent folder and examine the file, move it to another location, or delete it.
-
Click the Reports tab.
-
Highlight three consecutive rows.
-
Click Generate Report.
-
You can print the report or export it to several different formats.