Configuring Issue Stats thresholds
The Issue Stats page on the Dashboard view shows summary information about issues for the application versions, including the number of days that it is taking to review and fix them. To provide a visual indication of how quickly issues are being handled, the Issue Stats page displays colored bars next to the values for the Average Days to Review and Average Days to Remediate. A green bar indicates that issues are being managed quickly, a red bar indicates that issue management is too slow, and an orange bar indicates that issue management is somewhere between these two extremes.
How average days to review and average days to remediate are calculated
Before it calculates the Average Days to Review and Average Days to Remediate values, Application Security applies the following rules:
Application Security excludes the following issues from its calculations:
- All issues that were audited or removed 365 days ago or earlier
- All suppressed issues
- Issues that have not been either audited or removed
To calculate issue aging for audited issues, Application Security uses the date and time on which the issue was first audited.
For issues that were not audited but were removed, Application Security uses the removal date as the audit date.
To calculate issue dates, Application Security performs the following to clean up dates and times:
- Adjusts issue found dates and times to 12:00 AM of the date the issues were found.
- Adjusts issue audited dates and issue removed dates to 12:00 am of next day.
These adjustments are required to calculate average dates correctly. For example, without these adjustments, the calculated averages would be zero for issues that were found and audited on the same date, which is not correct. For an issue found on March 2 and audited on March 5, the days to review is 5 – 2 + 1, or 4 days.
After it applies all these rules and makes time and date adjustments, Application Security calculates the average of two values—(auditTime - foundDate) and (removedDate - foundDate)—to get average number of days to audit and remediate issues.
Setting the Issue Stats thresholds
You set the thresholds that determine what users see when they review summary information about the application versions to which they have access. By default, the Issue Stats page displays values of fewer than 100 days (minimum) in green, any values greater than 365 days (maximum) in red, and values in between in yellow.
To set the color thresholds for Average Days to Review and Average Days to Remediate:
On the header, select Administration.
On the navigation pane, under Metrics & Tracking, select Issue Age.
The Issue Age page opens. The default minimum and maximum values for Average Days to Review and Average Days to Remediate are set to 100 and 365, respectively.
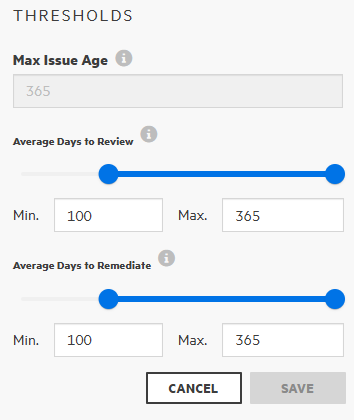
To reset the thresholds for the average number of days to review Issues, under for Average Days to Review, do one of the following:
- Adjust the slider control.
- Change the values shown in the Min and Max boxes.
To reset the thresholds for the average number of days to remediate Issues, under for Average Days to Remediate, do one of the following:
- Adjust the slider control.
- Change the values shown in the Min and Max boxes.
- Click SAVE.