Comparing Scans
You can compare the vulnerabilities revealed by two different scans of the same target and use this information to:
- Verify fixes: Compare vulnerabilities detected in the initial scan with those in a subsequent scan of the same site after the vulnerabilities were supposedly fixed.
- Check on scan health: Change scan settings and verify that those changes expand the attack surface.
- Find new vulnerabilities: Determine if new vulnerabilities have been introduced in an updated version of the site.
- Investigate Issues: Pursue anomalies such as false positives or missed vulnerabilities.
- Compare authorization access: Conduct scans using two different user accounts to discover vulnerabilities that are unique or common to both accounts.
Note: Data from both scans must be stored in the same database type (SQL Server Express Edition or SQL Server Standard/Enterprise Edition).
Selecting Scans to Compare Scans
To compare two scans, do one of the following:
-
From the Manage Scans page, select two scans and click Compare.
-
From a tab containing an open scan (which will be Scan A in the comparison):
-
Click Compare.
-
Select a scan from the list on the Scan Comparison window. This scan will be Scan B in the comparison.
-
Click Compare.
Note: If the open scan is a "site retest" (resulting from Rescan > Retest Vulnerabilities), Fortify WebInspect automatically selects the parent scan for comparison. For example, if you created a scan named "zero," and then verified vulnerabilities for that scan, the resulting scan would be named (by default) "site retest - zero." With the retest scan open, if you select Compare, Fortify WebInspect will compare "site retest - zero" with the parent scan "zero."
-
A warning message appears if the selected scans have different start URLs or used different scan policies, or if the scans are of a different type (such as a Basic Scan vs. a Web service scan). You can choose to continue, or you can terminate the function.
You cannot conduct a comparison if either of the scans is currently running.
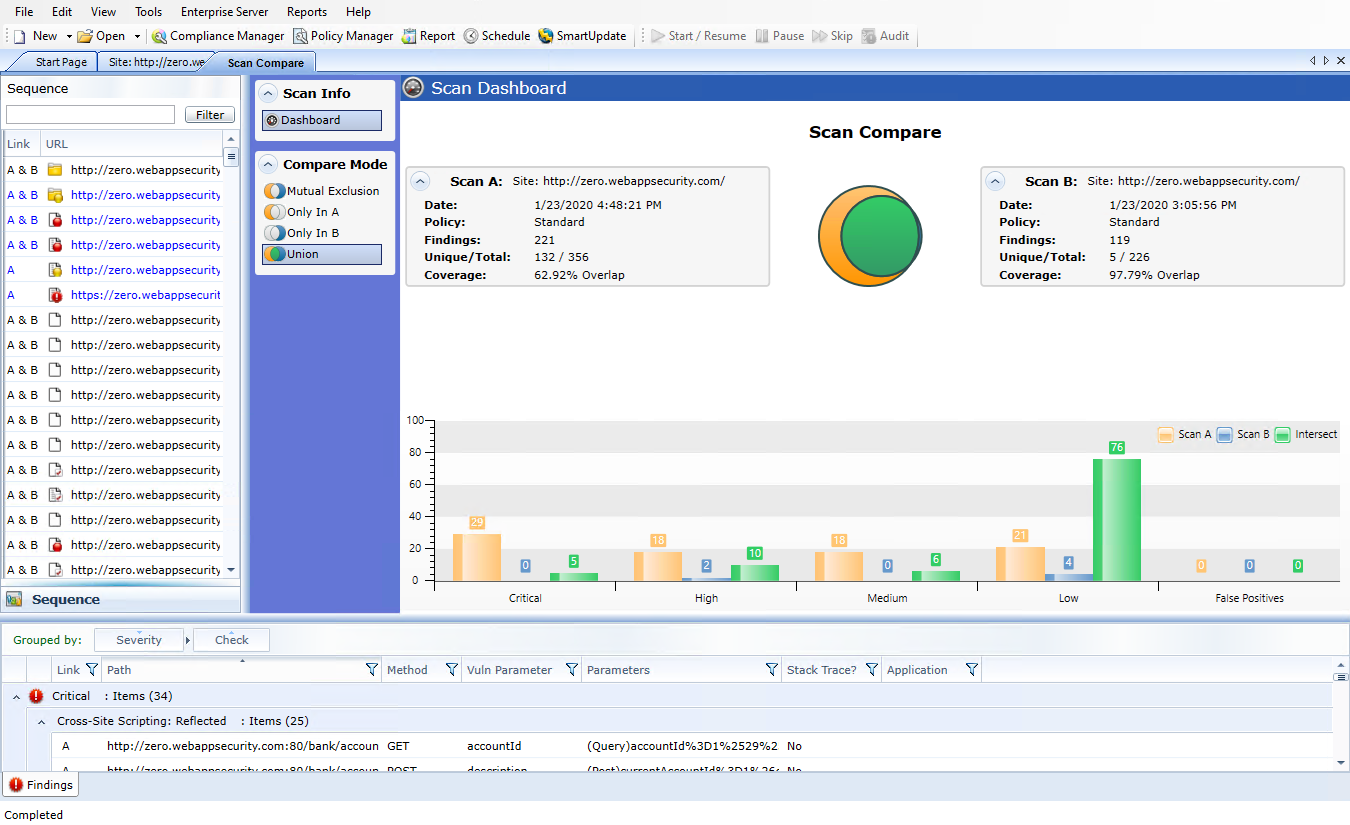
Reviewing the Scan Dashboard
The Scan Dashboard displays the scan comparison results.
Scan Descriptions
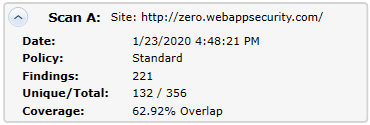
The Scan A and Scan B boxes provide the following information of the scans:
-
Scan A or Scan B: Name of the scan.
-
Date: Date and time the original scan was conducted.
-
Policy: Policy used for the scan; see Fortify WebInspect Policies for more information.
-
Findings: Total number of issues identified on the Findings tab, as well as false positives detected.
-
Unique/Total: Number of unique sessions created for this scan (that is, the number of sessions that appear in this scan and not the other scan), compared to the total number of sessions for this scan.
-
Coverage: Percentage of sessions that are common to both scans.
The Venn Diagram
The Venn diagram depicts the session coverage of Scan A (represented by a yellow circle) and the session coverage of Scan B (represented by a blue circle). The intersection of the two sets is represented by the green overlap. (In prior releases, the Venn diagram represented the overlap of vulnerabilities.)
The Venn diagram is scaled to reflect the actual relationship between the sets.
Several examples of session coverage overlap are illustrated below.

|

|

|

|

|
|
No Intersection |
50% Intersection |
A Encompasses B |
Most of A Intersects B |
Complete Intersection |
Vulnerabilities Bar Chart
In separate groupings for each vulnerability severity and for False Positives, the bottom of the Scan Dashboard displays a set of bar charts that show the number of vulnerabilities found in Scan A, in Scan B, and in their intersection (Intersect). The same color coding is used as in the Venn diagram. These bar charts do not change based on the selected Compare Mode.
Effect of Scheme, Host, and Port Differences on Scan Comparison
Fortify WebInspect does not ignore the scheme, host, and port when comparing scans from two duplicate sites that are hosted on different servers.
For example, the following site pairs would not be correlated in a scan comparison because of differences in scheme, host, or port:
-
Scheme
-
Site A - http://zero.webappsecurity.com/
-
Site B - https://zero.webappsecurity.com/
-
Host
-
Site A - http://dev.foo.com/index.html?par1=123&par2=123
-
Site B - http://qa.foo.com/index.html?par1=123&par2=123
-
Port
-
Site A - http://zero.webappsecurity.com:80/
-
Site B - http://zero.webappsecurity.com:8080/
Compare Modes
You can select one of the following options in the Compare Mode section to the left of the Scan Dashboard to display different data in the Sequence area in the left pane (the data in the Scan Dashboard is not affected):
- Mutual Exclusion: Lists sessions that appear in Scan A or Scan B, but not in both scans
- Only In A: Lists sessions that appear only in Scan A
- Only in B: Lists sessions that appear only in Scan B
- Union (the default): Lists sessions that appear in Scan A, Scan B, or both Scans A & B
Session Filtering
The Sequence pane lists each session that matches the selected Compare Mode. An icon to the left of the URL indicates the severity of the vulnerability, if any, for that session. The severity icons are:
| Critical | High | Medium | Low |

|

|

|

|
At the top of the Sequence pane, you can specify a filter and click Filter to limit the set of displayed sessions in the following ways:
- You can enter the URL with only its starting characters, as a "starts with" match. Your entry must begin with the protocol (http:// or https://).
- You can search for an exact match by specifying the URL in quotes. Your entry must begin with the quotes and protocol ("http:// or "https://)
- You can use an asterisk (*) as a wildcard character at the beginning or end of the string you enter.
- You can use asterisks (*) at both the beginning and end of the string you enter, which requires matches to contain the string between the asterisks.
- You can enter a question mark (?) followed by a full query parameter string to find matches to that query parameter.
Using the Session Info Panel
When you select a session in the Sequence pane, the Session Info panel opens below the Compare Mode options. With a session selected, you can select an option in the Session Info panel to display more details about that session to the right of the Session Info panel. If the session contains data for both scans, the data for some functions such as Web Browser, HTTP Request, and Steps are shown in a split view with Scan A on the left side and Scan B on the right side.
Note: The Steps option displays the path taken by Fortify WebInspect to arrive at the session selected in the Sequence pane or the URL selected in the Summary pane. Beginning with the parent session (at the top of the list), the sequence reveals the subsequent URLs visited and provides details about the scan methodology. In a scan comparison, if any of the steps for the session are different between the scans, the In Both column is added to the Steps table (as the first column). A value of Yes in the column for a particular step indicates that the step is the same for that session for both scans A and B. A value of No in the column for a particular step indicates that the step is different for that session between scans A and B.
Using the Summary Pane to Review Vulnerability Details
When comparing scans, the horizontal Summary pane at the bottom of the window provides a centralized table of vulnerable resources and allows you to quickly access vulnerability information. You can drag the horizontal divider above the table to show or hide more of the Summary pane.
The set of entries (rows) displayed in the Findings tab depends on the option selected for Compare Mode, as reflected in the Link column in the table.
Grouping and Sorting Vulnerabilities
For information on grouping and sorting vulnerabilities, see Summary Pane and Using Filters and Groups in the Summary Pane.
Filtering Vulnerabilities
You can click the filter icon ( ) at the right of any column heading to open a filter that allows you to choose a variety of conditions regarding that column that must be met in order for a vulnerability (row) to remain listed in the table after filtering. The available conditions include the full set of current values in the column, and you can also specify logical expressions regarding the content of that column.
For example, in the filter for the Vuln Parameter column, suppose you:
- Leave the top set of check boxes as is.
- Below the Show rows with value that text, select Contains from the drop-down menu.
- Type Id in the text box below the drop-down menu.
- Click Filter.
Then the table will show only rows that contain the text "Id" in the Vuln Parameter column. This would include rows for which the value of Vuln Parameter is accountId or payeeId or any other entry that includes "Id."
You can specify filters for multiple columns, one column at a time, and they will all be applied.
If a filter for a column has been specified, its icon becomes a darker blue than the icons for unused filters.
To quickly clear a filter, click Clear Filter while the filter is open to be specified.
Working with Vulnerabilities
Right-clicking an item in the Summary pane displays a shortcut menu containing the following commands:
-
Copy URL: Copies the URL to the Windows clipboard.
-
Copy Selected Item(s): Copies the text of selected items to the Windows clipboard.
-
Copy All Items: Copies the text of all items to the Windows clipboard.
-
Export: Creates a comma-separated values (csv) file containing either all items or selected items and displays it in Microsoft Excel.
-
View in Browser: Renders the HTTP response in a browser.
Note: For Post and Query parameters, click an entry in the Parameters column to display a more readable synopsis of the parameters.
See also