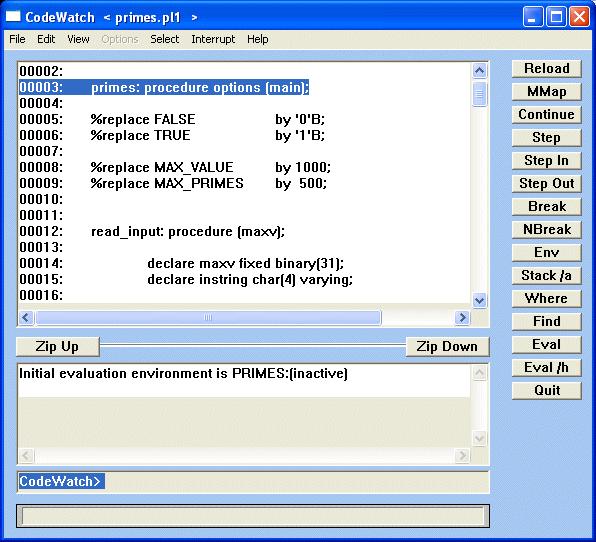
Figure 2-1: CodeWatch Display - Windows.
This chapter provides information to help get you up and running with CodeWatch. The following sections discuss program preparation, invoking the correct interface, CodeWatch files, multiple modules, and basic window and dialog navigation.
A program must be compiled using the -deb option before it can be run under the control of the debugger. This is because the compiler generates a data base file referred to as the STB file. This file contains symbolic information that the debugger needs to reference to manipulate source program symbols and entities; set breakpoints, tracepoints, and watchpoints; and control program execution. A program is referred to as being compiled in debug mode when one or more of the program modules have been compiled with the -deb option.
For example, a PL/I program contained in a source file named primes. pl1 is compiled in debug mode by entering the following command line:
mfplx primes.pl1 -deb
Once the program has been compiled in debug mode and linked, you can use CodeWatch to debug your program. To invoke CodeWatch, use one of the following command formats:
cwgui [-e]
      [-srcpath [source_directory [:source_directory] ...]]
      [-stbpath [STB_directory [:STB_directory] ...]]
      [-path [directory [:directory] ...]]
      [-usrin filename]
      [-usrout filename]
      [-8bit]
      [program-name]
[program-arguments]cwcmd [-classic]
[-x]
[-e]
[-srcpath [source_directory [:source_directory] ...]]
[-stbpath [STB_directory [:STB_directory] ...]]
[-path [directory [:directory] ...]]
[-usrin filename]
[-usrout filename]
[-8bit]
[program-name]
[program-arguments]
where:
| -e (echo) | Specifies that every debugger command entered will be echoed back to the terminal. |
| -srcpath, -stbpath, and -path | Specify directory paths to be searched for source and STB files. See "In Search of Source and STB Files" for more information. |
| usrin and -usrout | Specify files to redirect user program input from or output to, respectively. See "Redirecting User Program I/O" for more information. |
| 8bit | Allows CodeWatch to treat an extended set of ASCII characters as printable. See "Extended ASCII Character Support" for more information. |
| program-name | Is the name of the executable file to be debugged. If the debugger is invoked without a program-name argument, the a.out file in the current directory will be used if it exists; otherwise, CodeWatch comes up "standalone." |
| program-arguments | Are command-line arguments to be passed to the program. |
CodeWatch does not require a program-to-debug at startup time. If no program-to-debug is supplied to CodeWatch, CodeWatch comes up standalone. However, on UNIX systems, it will first look for a.out as the default program name. When CodeWatch comes up standalone, a LOAD or ATTACH command must be used to specify the program to be debugged.
When a program source file is compiled in debug mode, a file called the STB file (symbol table file) is created, which contains important information needed by the debugger during the debugging session. The name of this file is constructed by replacing the extension of the source file name (for example, .pl1 for a PL/I program), with an .stb extension. This STB file is placed by default in the directory in which the compilation took place.
Code Watch handles compressed STB files. If you wish to compress your STB files, do so, and the debugger will uncompress them when it needs to access them. This happens, for example, when you step into a new evaluation environment for which the STB file has been compressed. An STB file is only uncompressed once during a debug session and remains uncompressed until you quit the debugger.
When you quit the debugger, you will be given a list of STB files that have been uncompressed during the debug session. You will be asked whether or not you would like to re-compress the files.
When quitting the debugger, you need not wait while all the STB files are being re-compressed. The re-compression process is forked off into another process.
Debug sessions run by another user accessing the same set of STB files with which you are working will not compress or uncompress an STB file out from under you. When the debugger is in the process of uncompressing an STB file, it writes a lock file to the directory in which your STB files reside, telling other debugger processes to wait until the uncompression is finished (for that STB file).
Note: To write the lock file and to do the actual uncompression you must have write permission to the directory in which your STB files exist.
It is possible to use a compression utility other than compress. To do this, you must set the following three environment variables:
| CW_COMPRESS_COMMAND | Set This environment variable to the command used to compress the STB files. |
| CW_UNCOMPRESS_COMMAND | Set This environment variable to the command used to uncompress the STB files. |
| CW_COMPRESS_SUFFIX | Set This environment variable to the suffix that denotes that the file is compressed (.Z for the compress utility). |
The following are command-line examples for setting these environment variables:
setenv CW_COMPRESS_COMMAND   pack
setenv CW_UNCOMPRESS_COMMAND unpack
setenv CW_COMPRESS_SUFFIX    .z
The following command-line switches are used for the handling of compressed STB files:
| -nocompress | Tells the debugger not to look for compressed STB files. If you are not going to compress your STB files, this is a good switch to use, because it saves the debugger that extra time of looking for compressed STB files. |
| -forcecompress | Causes the debugger to re-compress automatically any files that have been uncompressed during the debug session, without prompting you when you Quit out of the debugger. In the command-line interface, you will still be given a list of which files will be re-compressed, but in the Windows interface you will not be given this information. |
After the program is linked and CodeWatch is invoked with the loaded executable file as an argument, the debugger requires access to both the program source file(s) and the STB file(s).
The source file(s) will, by default, be searched for first in the directory that was specified to the compiler (relative to the current directory), and if not found, then in the current directory.
The STB file(s) will, by default, be searched for first in the current directory (where they are created), and if they are not found, they will be searched for in the directory that was specified to the compiler. This is the exact opposite of the search algorithm used for source files.
It is possible through the use of debugger command-line arguments and/or environment variables to specify alternate directories in which to search for both source and STB files before the default directories are searched.
The CodeWatch options -srcpath and/or -stbpath, followed by a list of directory names separated by colons (:), may be given to specify a list of directories to be searched before any other directories are searched. These directory lists will be searched (in order) for source files and/or STB files, respectively. If a directory list starts with a colon, the current directory (.) is assumed to be first (a trailing colon is ignored). The -path option followed by a directory list will be used in place of the -srcpath option and/or the -stbpath option if one or both is not given.
If the source and/or STB files are not yet found after searching any directories specified when invoking CodeWatch, the debugger will search directories specified by environment variables in a similar manner. The environment variables CODEWATCH_SRCPATH and/or CODEWATCH_STBPATH may be set to a list of directory names, separated by colons. These directory lists will be searched (in order) for source files and/or STB files, respectively. The environment variable CODEWATCH_PATH followed by a directory list will be used in place of the CODEWATCH_SRCPATH environment variables and/or the CODEWATCH_STBPATH environment variables if one or both is not given.
For example, the following command:
cwgui -srcpath :/pl1progs/src:/src/pl1progs\ -stbpath /pl1progs/stb:/pl1progs/obj program-name
will cause the debugger to search for the source files in the following directories in order:
The debugger will search for the STB files in the following directories in order:
When a user program is run under CodeWatch, there are three ways to specify that input and/or output be directed to/from another file.
When either the input or output is redirected, CodeWatch attempts to open the specified file(s) in the appropriate mode. If the open fails, CodeWatch prints an error message and exits.
Note: When the program normally continues to completion (for example, by using the Continue or Step command) and is automatically reloaded by CodeWatch, output redirection is preserved in append mode, while using an explicit Reload resets output redirection to the terminal.
Normally, the debugger considers a range of ASCII characters to be unprintable. When the debugger evaluates a given data item, a dot "." is printed instead of each character within that range. The "unprintable" ASCII range is usually any character whose ASCII value is less than 32, within the range of 127 to 159 inclusive, or greater than 254. When using the -8bit command-line option, the debugger will not assume that the ASCII characters within the range of 127 to 159 inclusive are unprintable. As a result, printable characters within the extended ASCII character set, which are supported by some terminals, are allowed to be printed. This is especially useful for terminals that support languages other than English.
Upon invocation of the debugger, a command file containing debugger commands is automatically executed, if present. The debugger searches for this file in the following locations in the given order:
As soon as one of these files is found, the debugger commands contained within it are executed, after which normal interactive debugging may continue. It is not required that a start-up file exist.
Not all source modules need to be compiled in debug mode to use CodeWatch. You may compile in debug mode only those modules you want to debug.
If you debug a program with multiple modules and the main program is compiled in debug mode, the initial environment will always be the main program module.
If the main program is not compiled in debug mode, the initial environment will be the first debug module specified in the link step.
The COBOL program amort.cob, used in the section Sample Session Using LPI-COBOL is an example of a program with multiple modules. To debug just the subprogram MPCALC, only mpcalc.cob needs to be compiled in debug mode. To do this, use the following command sequence:
$ lpicobol amort.cob
$ lpicobol mpcalc.cob -deb
$ ldcobol amort.o mpcalc.o -o amort
$ cwcmd amort
Note: The dollar character ($) in this command sequence is the system prompt.
The debugger is then invoked and MPCALC is the initial evaluation environment.
To end a debugging session, enter the QUIT command at the command-line prompt or select Exit from the File menu in the Windows interface.
Using either method causes normal termination of the debugger and the termination of your program. Once the debugging session has been terminated, the system prompt will be displayed.
Keyboard interrupts while the debugger is accepting commands are ignored, but a keyboard quit (for example, <Ctrl \>) will terminate the debugging session.
Programs that terminate normally while running under the control of CodeWatch will automatically be re-initialized with any explicitly set breakpoints, watchpoints, and tracepoints (and any associated action-lists) preserved, so that execution may start from the beginning if desired. However, breakpoints that may have been set in shared libraries will not reset if the library is not loaded at program setup. The exit status with which the program exited is given. Refer to your UNIX documentation (exit (2)) for more information.
The Codewatch graphical display consists of a source window, output window, and edit-line used for command-line input, plus a set of user customizable buttons.
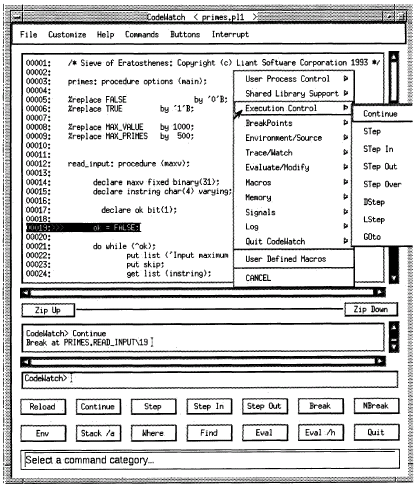
The Codewatch display is illustrated for the Windows and UNIX platforms in the following two figures.

Figure 2-1: CodeWatch Display - Windows.

Figure 2-2: CodeWatch Display - UNIX.
The CodeWatch graphical interface is a simple and intuitive, easy-to-use interface. It is easy to learn, while allowing more advanced users to debug programs efficiently.
The graphical interface is closely connected to the command-line interface. It uses source and output windows to display text and customizable buttons, which allow you to quickly execute and/or edit commands.
All of the commands that the command-line interface supports are also supported in much the same way via the graphical interface Edit-line.
From the Menu Bar, clicking on Commands, Help, or Buttons presents the same popup command menu. This menu is divided into items that comprise functionality groups, and then subitems that correspond to all of the supported commands for that group. Hence, it is easy to see the functionality and commands that CodeWatch supports for, say, Program Control, and either get help for a command, execute or edit a command, or add a new button corresponding to a command.
Buttons are a mechanism for quickly entering a command either immediately or via the Edit-line. Under Buttons on the Menu Bar, Button Mode allows for quick execution of clicked buttons, or an edit/confirm mode that allows editing and/or confirmation of the command.
When you use the quick button mode, most buttons execute immediately, as does "Step," while buttons that require arguments always use Edit/Confirm mode.
Buttons that require a text string or line number operate in "quick" mode if the text or line number is selected prior to the button selection.
Note that on some systems, double-clicking causes the next blank-delimited text string to be selected. In this case, both a text and line number have been selected, and CodeWatch will use each appropriately for upcoming button selections.
For example, suppose you wish to Break on line 27. Use the scroll bar in the source window to move line 27 into view (if necessary), double-click anywhere on line 27, and then click the Break button. Clicking the Break button without having previously selected a line would have resulted in the Edit/Confirm mode being used.
Since the Breakpoint command (usually) requires a line number, clicking on Edit in the popup menu will place the cursor in the Edit-line. Press Return to execute the final command.
Similarly, for commands that operate on text strings, selecting text as described above and clicking a button will cause the selected text to be used as an argument to the command. For example, selecting the text string "count" from the Source window and clicking the Evaluate button will cause the variable name "count" to be evaluated in the current environment.
Thus, selecting text and line numbers for use in conjunction with buttons (and in fact, any command selected from the Command Menu in the menu bar), is actually a shorthand way of entering commands via the Edit-line.
You can find a complete description for each of the Codewatch commands in Chapter 6 or by accessing Help from the Menu Bar.
Copyright © 2009 Micro Focus (IP) Ltd. All rights reserved.