This chapter describes how to set about diagnosing common problems that can occur with running applications in Enterprise Server and gives some advice about overcoming them.
For all troubleshooting exercises it is essential to gather as much information as possible about the state of the enterprise server when the problem occurred and about the events leading up to the problem.
Diagnostic aids that you can use to provide information include:
When a problem actually occurs, you need to capture not only the current log files, dumps and traces, but also the contents of various files, directories and areas, and the output from a number of operating system tools. It is important to have data capture mechanisms in place in advance of a failure so that the data can easily be obtained when required. In a production system, we recommend that you restore the enterprise server service to its clients before you start analyzing the data you have captured. We also recommend that you perform data capture on the enterprise server in a healthy state shortly after the supporting operating system has been rebooted and the enterprise server started. You should retain this healthy data capture to compare with the failure data capture.
You should also check whether the enterprise server is responding to client requests, and to requests from ESMAC. Lack of response points to problems with the communications process (MFCS).
The Directory Server logs events to its journal, usually C:\Documents and Settings\All Users\Application Data\Micro Focus\reUZE Developer\X.X\journal.dat. The most recent entries are also available on a page of the Enterprise Server Administration Web interface.
You can change the maximum file size, the number of entries displayed and the level of logging on the Configure Options page of Enterprise Server Administration. When the journal reaches the maximum file size set, the most recent journal entries overwrite the oldest journal entries. For troubleshooting purposes, you might want to increase the maximum file size to 256 KB or more.
The three levels of logging available are:
For troubleshooting purposes, you might want to set the maximum level of logging.
Each Enterprise Server writes log, dump and trace information to files in its System Directory. The default location for the System Directory is usually C:\Documents and Settings\user-ID\My Documents\Micro Focus\reUZE Developer X.X\WORKAREA\es-name (where user-ID is the user account that is running Enterprise Server).
You can change the location of the System Directory by editing the Enterprise Server's definition in Enterprise Server Administration.
Note: If you are running the Directory Server as a service that logs on as the Local System account (LocalService), any Enterprise Server that it starts will also run under that account. Hence, the default location of the log file will be C:\Documents and Settings\LocalService\My Documents\Micro Focus\reUZE Developer X.X\WORKAREA\es-name\console.log. By default, Windows hides the LocalService subdirectory of Documents and Settings. In order to view this directory, you must configure your Windows Explorer so that: Show hidden files and folders is set, and Hide protected operating system files is not set.
An enterprise server logs messages to a file, console.log, in its System Directory.
When an enterprise server starts, it renames any existing console.log file to console.bak, erasing any existing console.bak file. You should include both console.log and console.bak in your data collection. Make sure you copy them to a safe place before restarting the enterprise server.
Communications processes (MFCS) log messages to the communications process log file, log.html, in its System Directory.
If multiple communications processes are running, the date and time stamp at the beginning of each message is followed by an instance identifier in square brackets, for example, [2].
By default, there is only one log file which grows continuously until it is deleted by an administrator. However, you can use the mf-server.dat file to activate rotating log files, and to change the level of logging. The mf-server.dat file normally goes in install-dir\base\bin. It uses the ini-file format of section tags in square brackets followed by name=value pairs.
With rotating log files, MFCS uses multiple log files, named log-1.html, log-2.html, etc. When a log file reaches a configured size, MFCS moves on to the next file (which will be deleted first if it already exists). When it reaches the configured number of log files, it returns to log-1.html, overwriting it.
The syntax is as follows:
[logging]
 files=number-of-files
 filesize=maxsize
 dscontrol=none|standard|all
 dirsvc=none|unusual|processing|not-found|all
All the parameters are optional. However, to activate rotating log files, both files= and filesize= must be set, and files= must be set to a number greater than 1. These parameters configure rotating log files, as explained above. If both are set, then the total log file space required by MFCS will not exceed files*filesize (approximately). For example, to limit the log to three files of 100 KB each:
[logging]
files=3
filesize=100
The parameters are explained below.
Specifies the number of log files
files=number-of-filesSpecifies the maximum size of a log file in kilobytes (KB)
filesize=maxsizeSets the level of logging for control messages. These messages normally come from Directory Server (MFDS) though they can come from other sources as well. These messages include server monitor probes, requests for log and dump data, and dynamic configuration changes.
dscontrol=none|standard|all
| none | Don't log control messages. |
| standard | Log control messages that update MFCS configuration or status. Don't log messages that just request information, such as the KEEPALIVE probe messages that MFDS uses to check if the enterprise server is still running. |
| all | Log all control messages. |
You might want to set this to "all" if you are investigating a problem with the server monitor or other control flows, or set it to "none" if you want to avoid logging messages about configuration changes or other control requests.
| Default: | standard |
Sets the level of logging for the attempts of MFCS to query or update the Directory Server repository. Sometimes it's useful to set this to help diagnose a configuration problem.
dirsvc=none|unusual|processing|not-found|all
| none | Don't log information about Directory Server activities. |
| unusual | Only log unusual results, such as duplicate object names, which may indicate configuration problems. |
| processing | Also log some messages about the progress of normal processing. This is the default. |
| not-found | Also log some messages about searches that return a not-found status. Normally these are not logged because MFCS expects some optional configuration items to be missing if they are not needed. In some cases, though, logging all not-found results may help diagnose configuration issues. |
| all | Log even more information, including normal MLDAP unbind operations. |
| Default: | processing |
We recommend that you always run a production system with some diagnostics switched on. This is necessary so that you can diagnose unexpected problems. Diagnostics consume resources, and there is always contention between problem determination facilities and performance. You need to decide how important it is to be able to diagnose a problem the first time it occurs rather than having to try to recreate it or having to just turn on diagnostics and wait for it to reoccur. We suggest the following level of diagnostics as a minimum:
You might also need to turn on tracing for task control, storage control and application container components.
You specify settings for traces and internally triggered dumps on the Edit Server > Diagnostics page or the Control page of ESMAC. The trace flags on the ESMAC Control page that are equivalent to the trace flags on the Edit Server > Diagnostics page are as follows:
| Edit Server > Diagnostics page | ESMAC Control page |
|---|---|
| Application | API |
| Task Control | KCP |
| Storage Control | SCP |
| Application Container | RTS |
Settings you make on the Edit Server > Diagnostics page override those you make on the ESMAC Control page.
Dumps created when the system or a transaction abends are internally triggered dumps; as long as you have selected them on the Control page, they will be created when abends occur. You can also obtain an externally triggered dump, that is, a dump that is taken immediately in response to a command. There are several ways of initiating an externally triggered dump:
Note: casdump will not work if the Directory Server is running as a system service and you started the server from the Enterprise Server Administration interface, because the server will not be running under your user ID; in order for casdump to work you must do one of:
casdump gives you more flexibility. Run it first without the /d option, which means "do not lock shared memory":
casdump /res-name
Running without this option might cause the command to fail due to shared memory being changed by the running enterprise server while it is chasing and dumping storage chains. It is still worth running the command without the /d option, because it dumps all of shared memory as a block at the very beginning before it starts to chase chains and format blocks.
If the command hangs, you can run it again with the /d option:
casdump /res-name /d
This command might hang if the enterprise server fails in such a way that it leaves shared memory locked.
If you are planning to send the dump file to Micro Focus for investigation, you might also be asked to run the command with the /f option; this option dumps the FAQE chain (Free Area Queue Element) which provides more information about the use of shared memory.
An externally triggered dump is written to the dump X dataset, casdumpx.rec, if you specify the /d option, or the current dump dataset casdumpa.rec or casdumpb.rec if you do not specify it.
By default, Enterprise Server does not create a core dump for run-time errors. For example, by default, if the operating system detectes a memory access violation caused by your application, no core dump is produced. You must configure the system to produce a core dump for these situations.
Once you have produced a core dump, you can debug the core dump to help determine the cause of the error.
Note:
To configure the system so that it creates a core dump for run-time errors, you need to create a run-time tunable configuration file, and add the tunable configuration file's details to your Enterprise Server region.
SET CORE_ON_ERROR=131
SET CORE_FILENAME="core.%p@%t_%d"

Figure 11-1: Configuring Enterprise Server core dumps for run-time errors
To produce and debug a core dump
The minimum items for data capture are:
Note: If the enterprise server is running under the Windows LocalService account, the directory may be hidden by Windows. See System Directory for more information.
Notes:
It is important that the data capture process is non-destructive, that is, does not damage a healthy system, and that it is non-blocking, that is, does not wait on anything that may not complete in a sick system.
When you take the data capture, you should also check that the communications process (MFCS) is still running. If it is, you can then check what it is currently doing. To do this:
http://hostname:port/MF_KEEPALIVE
where hostname is the hostname (or IP address) from step 1 and port is the first port number from step 2.
If MFCS is working correctly, you should see a response similar to the following:
Server=ESDEMO
ServerType=GKC
Version=1.2.5
Status=Started
If you are running multiple communications processes, you can check each one in turn using this method. Each of the port numbers you recorded in step 2 corresponds to a communications process. Note that some of your communications processes for a given server may be disabled; they do not need to be checked.
Failures fall into the following categories:
Key initial classifiers for a failure are:
These classifiers coupled with the external symptoms should provide enough information to assign the failure to one of the types of failure listed.
The next step here is to differentiate between application problems and enterprise server infrastructure problems.
Application failures other than abends are often application problems. Look at the active trace dataset coupled with the system trace table in the dump X dataset (casdumpx.rec) to establish the application activity before the failure.
Application abends can be due to application problems or enterprise server infrastructure problems. Look in the active dump dataset for an RTS error dump. If found, evaluate the RTS error and classify the problem from this. What module experienced the failure, application or enterprise server infrastructure?
Inspect the system console log for messages indicating the cause of the shutdown and classify the failure from these.
Use the name of the looping process to classify the failure. If the looping process is a service execution process (cassi), the loop could either be in an enterprise server subsystem or in the application; look at the active trace dataset and the system trace table from the dump X dataset to determine which module last got control. If it was the application, consider using FaultFind on the process to acquire more information on the next occurrence of the failure.
If the looping process is cassi but the last module to get control was not part of the application, or if the looping process is not cassi, you should refer the problem to Micro Focus technical support.
Find out whether all client requests are suffering from lack of response from the enterprise server, or just one type of request.
Consider the possibility that the application is suffering the effects of resource contention. Consider the possibility that the service listener has failed.
Try dynamically increasing the number of service execution processes by clicking Details in the Current status column, then on the Enterprise Server Details page, specifying the new number in Requested Service Execution Processes and clicking Update. The new processes should appear in the list after a short delay. Success shows that shared memory is not locked and that the enterprise server is still functioning correctly at some level, even though the external symptoms of the problem might still be present.
Check the number of active service execution processes (cassi processes), using the dump X dataset. Inspect the despatch control blocks, one for each service execution process. Are all service execution processes currently occupied with a transaction? Is the occupying transaction the same for each cassi process or was the last command executed by each cassi process the same? If either of these is true, consider the following possibilities:
Another possibility is that the server's shared memory is locked. The best way to check for this is to compare the date and time of the last trace entry in the dump X dataset to the date and time of the dump. The larger the gap between the two times, the more likely it is that shared memory is locked. If shared memory is not locked, try to determine what the server is waiting for. If shared memory is locked, try to determine which process left shared memory in this condition.
You can obtain the most value from the diagnostics aids if you use one enterprise server solely for investigating problems, a diagnostics server. Such a server provides a stable view of the dump and trace data collected from the live server that experienced the problem.
A diagnostics server is just another enterprise server, and the diagnostics facilities available in ESMAC are just the same as the facilities available on any server. The only thing different about a diagnostics server is that it is configured not to produce any diagnostics itself. This allows it to be used to process the diagnostic information from another server. Figure 11-2 shows the recommended configuration for a diagnostics server.
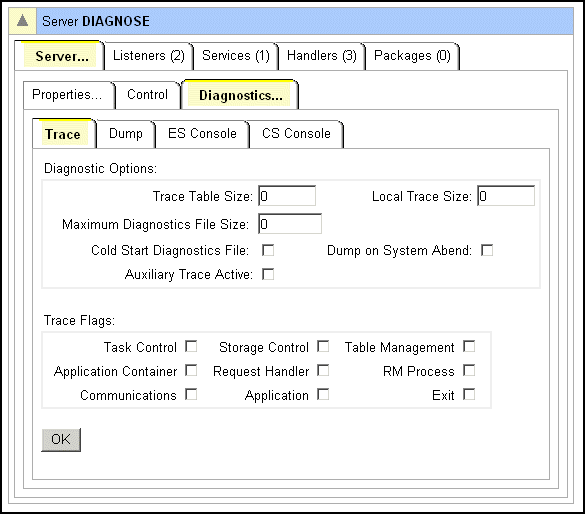
Figure 11-2: Configuration for a Diagnostics Server
Before you can start work on the data collected from the server that experienced the problem, you need to copy it into the diagnostics server. Here are the commands you need to move the collected data and the log files into a diagnostics server, assuming that:
If Enterprise Server is installed as part of reUZE Developer:
copy *.rec "C:\Documents and Settings\username\My Documents\Micro Focus
\reUZE Developer X.X\WORKAREA\diagnostics-server-name"
copy console.log "C:\Documents and Settings\username\My Documents\Micro Focus\
reUZE Developer X.X\WORKAREA\diagnostics-server-name\console.aux"
copy console.bak "C:\Documents and Settings\username\My Documents\Micro Focus\
reUZE Developer X.X\WORKAREA\diagnostics-server-name\console.bak"
Here is a sample script that copies the required data to a diagnostics server called diagnose:
copy *.rec "C:\Documents and Settings\username\My Documents\
Micro Focus\reUZE Developer X.X\WORKAREA\diagnose\"
copy console.log "C:\Documents and Settings\username\My Documents\Micro Focus\
reUZE Developer X.X\WORKAREA\diagnose\console.aux"
copy console.bak "C:\Documents and Settings\username\My Documents\Micro Focus\
reUZE Developer X.X\WORKAREA\diagnose\console.bak"
Restart the server that experienced the problem after you have moved the data to the diagnostics server.
Extra options exist for viewing the console log that only make sense in the context of a diagnostics server containing the diagnostic files from the problem server copied using the commands given above. To use these extra options:
This subject is covered in the help topic To view a system trace. However, the options are complex and it is worth looking at an example.
To obtain a trace of the system trace table, in the Diagnostics group of the menu click Trace and either A or B to select the A or B dataset. (Don't select C, since the in-memory trace table belongs to the diagnostics server). Then specify the number of trace blocks that are to be aggregated into one trace index entry in Blocks. Then click Display. Figure 11-3 shows a view of the trace index display.
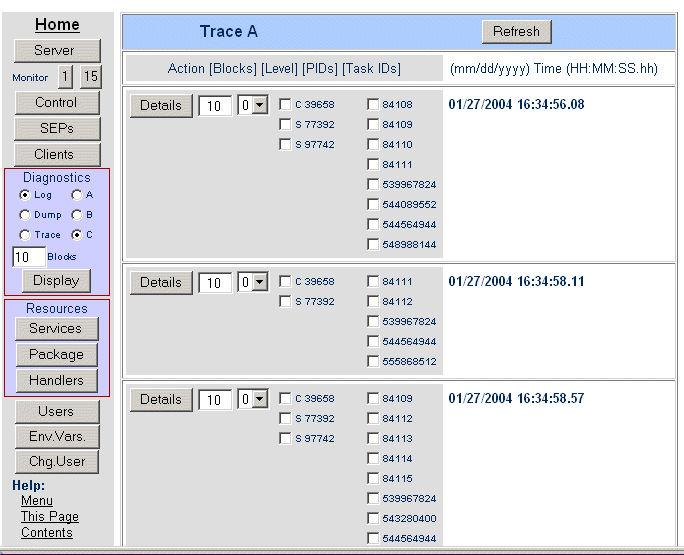
Figure 11-3: Trace Index Page
Each block is the same size as the system trace table, that is, it contains the number of trace entries specified in Trace Table Size on the Edit Server page for the server. The index entries are displayed with a timestamp against each one. This is the timestamp of the first trace entry in each set of blocks. These timestamps help you narrow down your search to particular events.
To view the actual trace, go to one of the index entries, and make selections in the following fields:
| 0 | Service start, module start, module end, service end. This is the default. |
| 1 | Enterprise server API entries and exits |
| 2 | Subsystem trace entries |
| 3 | All entries where it is possible to provide some formatting of the data |
| 4 | All trace entries |
| C | communications process (MFCS) |
| F | Fileshare server (internal) |
| J | journal control |
| M | server manager |
| R | recovery |
| S | service execution process (SEP) |
| U | unknown |
| Z | generic terminal or client |
The Level, PIDs and Task IDs controls are filters that help you select just the specific information of interest. If you leave the level as 0, the default, and don't check any process IDs or task IDs, you will see the minimum level of information for all processes and tasks that have entries in the block represented by the trace index entry. Note that it is possible to make selections such that no trace information is generated. This happens if you select both processes and tasks, and none of the selected tasks ran on the selected processes; a task cannot run on more than one process. If a task requires communications work, that work has its own process and task, and there is no automated way of relating the two task IDs. You always see the first trace entry in the block, irrespective of filtering.
Here is an example of how you can use the controls to select the information you want to see. Suppose you specify 10 in Blocks in the Diagnostics group of the menu. There are actually 60 blocks of information in the dataset, so 6 index entries are displayed. Suppose you were interested in a particular SEP, which you can see listed in the third and fourth index entries. You might then specify 20 in Blocks for the third index entry, check the box next to the process ID for the SEP, then click Details. Now you can only see trace entries for that SEP, in all the blocks that contain them, starting with the first block of the third index entry.
Each trace entry contains the following information:
| Heading | Contents |
| None | An interpretation of the traced event, if one can be supplied |
| Seq | Sequence number of the entry in ascending order |
| Task-Nbr | The five-digit task number |
| ProcessID | The five-digit process ID |
| ID | the ID of the event, command, or instruction that was traced. This is a four-byte hexadecimal number. |
| hhmmsshh | A time stamp that indicates when the trace entry was written. The time stamp is in hours, minutes, seconds, and hundredths of a second. |
| aaaa bbbb | Eight bytes of entry-specific data |
When you have finished viewing a trace, click Back to return to the trace index page.
This subject is covered in the help topic To view a dump. However, as with traces, the options are complex and it is worth looking at an example.
You can obtain either a summary or a detailed dump. The summary information is included at the end of a detailed dump. Dumps whether summary or detailed include both system traces and local traces (traces for SEPs).
To obtain a dump, in the Diagnostics group of the menu click Dump and either A or B to select the A or B dataset, or C to select the dump X dataset (the one created by an externally triggered dump). Ignore Blocks - it has no effect on the output. Then click Display. Figure 11-4 shows a view of the dump index page.
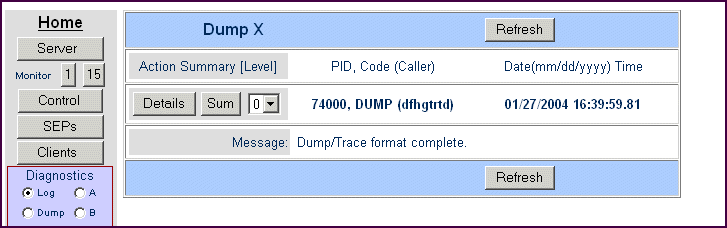
Figure 11-4: Dump Index Page
The index entries are displayed with the following information against each one:
To view a dump, go to one of the index entries, and in Level, (the third control to the right), specify the level of trace detail that you want to see in the formatted dump. The options are:
| 0 | Service start, module start, module end, service end. |
| 1 | Enterprise server API entries and exits |
| 2 | Subsystem trace entries |
| 3 | All entries where it is possible to provide some formatting of the data |
| 4 | All trace entries. This is the default |
Local trace tables (traces for SEPs) only have levels 0 and 1.
Note that this option has an effect on what you see in a detailed dump, but not in a summary dump.
Then click Details to see a full dump or Sum to see a summary dump.
When you have finished viewing a dump, click Back to return to the dump index page.
If you get an INVALID_CREDENTIALS error in the console log when an enterprise server starts up, as follows:
CASCD4002W Error (INVALID_CREDENTIALS) binding to MFDS
CASCD0102F TX Daemon Failed to Initialize
this indicates a problem with the internal files that hold details of Directory Server user IDs and passwords (in encrypted form). If you see this error, you should check that the following files exist in the Micro Focus Directory Server schema directory (usually C:\Documents and Settings\All Users\Application Data\Micro Focus\NetExpress\ver\MFDS):
These files are initially created from the install-dir\base\bin\cciusers.dat file. If there was a problem reading this file or creating the initial security information, you can attempt to recreate the data by re-importing this file. To do this:
This displays a page confirming the location of the cciusers.dat file, and asking whether you wish to replace all existing user information (default: yes).
Note: Import... is not available when your Directory Server is running in restricted mode.
To start an enterprise server requires that certain system user accounts exist. The user IDs required are mf_mdsa and mf_cs, and they should exist in the default cciusers.dat file which is shipped with the product.
Copyright © 2009 Micro Focus (IP) Ltd. All rights reserved.