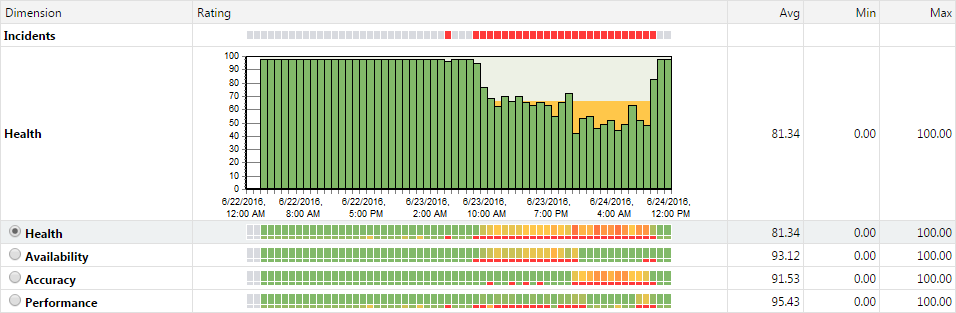
Average, minimum, and maximum ratings for each health component are listed in the Avg, Min, and Max columns respectively.
Health, Availability, Accuracy, or Performance can be selected to restrict the data shown in a diagram to a specific dimension. Only selected dimensions influence heat fields and are reflected in report details.
The Select range feature and the calendar feature are available throughout Performance Manager's Monitoring section (). The calendar's From and To rows allow you to specify start and end times for the period of time for which you want to view health statistics.
After specifying From and To times with the lists, click Update to update the report based on the new time range.
The hour, day, week, month, [last 24 hours] links allow you to bypass the drop-down calendar and simply view statistics for the most recent time period (past hour, past day, past week, past month, or past 24 hours).
You may also use the Forward and Backward arrows to increase/decrease the selected time range by specified intervals (one hour, one day, one week, or one month).
The magnifying glass Increase and Decrease links are useful for enlarging and reducing the range of time covered by the report. The Increase link enlarges the period of time by 50%. The Decrease link reduces the period of time by 50%.
After specifying a new time period, click Update to update the report.
If the calendar displays a custom interval, for example after zooming in or out, you can use the left-most arrows ( Earlier/Later) to increase/decrease the selected time range by half of the selected interval.
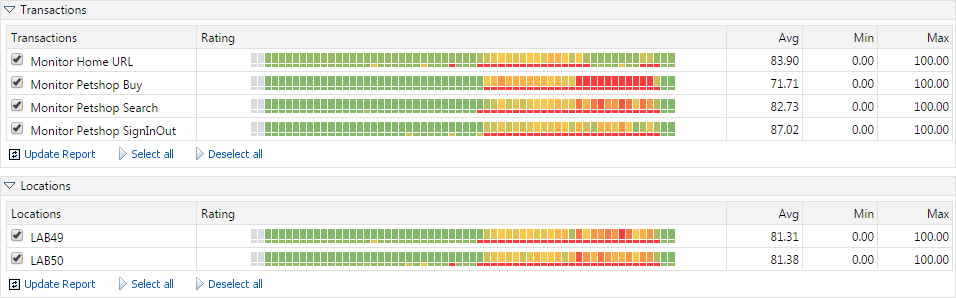
The Transaction portion of the client and infrastructure health reports reveals overall health statistics for each project transaction. Note that the time intervals in the Transaction section correlate with the time intervals of all other sections of the health report. This allows you to isolate detected problems by drilling down to more granular data. For example, an overall poor health rating might be the result of one of three transactions experiencing an error while the other two transactions are performing well. Isolating which transaction an error condition is tied to may speed up defect turnaround time.
Average, minimum, and maximum overall health ratings for each transaction are listed in the Avg, Min, and Max columns respectively.
(Client health only): The Location section of the client health report lists all of the locations where Performance Manager agents run monitors. It may be that the monitors at one location are returning availability errors while monitors at other locations are not experiencing problems. The Location section of the report might indicate that this is the result of network problems at the one troubled location-and not the result of global application unavailability.
Average, minimum, and maximum ratings for each location are listed in the Avg, Min, and Max columns respectively.