


The Availability portion of the Project Overview report () offers details regarding specific availability errors that were received during the selected time range. Example errors include Connection timed out, Connection refused, and No route to host.
To display the detailed information described below, click Show.
Shows the number of availability errors within the selected time span.
To see detailed analysis of the number of availability errors over time, click # Availability Errors. This takes you to the availability Details chart.
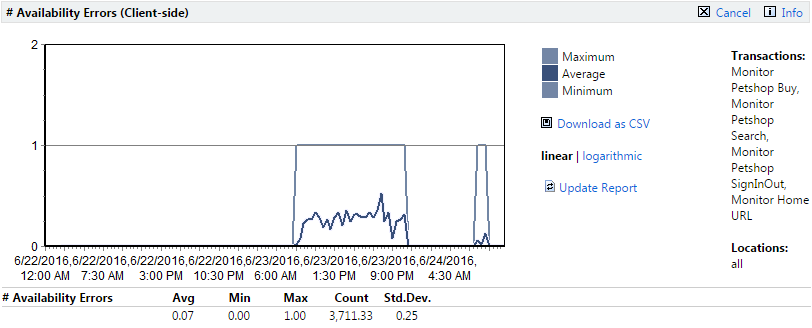
The chart shows how many availability errors occurred at a specific time. The base values are listed as well.
The Count column indicates how often this value was measured during a given time frame, independent of whether an error was actually reported or not.
Click an availability error to view a detailed listing of each of the transactions that resulted in that particular availability error.
Each error listing includes Timestamp, Message, Location, and Transaction details.
Errors can be sorted by clicking the timestamp and message column names or the Ascending/Descending arrow links. To change sort-order-by-column from ascending to descending (and vice-versa) click the appropriate Ascending/Descending arrow link.
Error listings offer the option of downloading .wrt files and .xlz TrueLog files. .wrt files contain information that is written with write and writeln Silk Performer script commands.
TrueLog information is tracked to support root-cause analysis of reported errors. TrueLog files can be downloaded as WinZip archives (extension .zip). "Zipped" TrueLog files are automatically extracted when opened with TrueLog Explorer and are recommended for use when limited bandwidth is an issue. You can click any monitor execution to display detailed diagrams that cover monitor-execution statistics such as page times, connection times, and handshake times. See the Working with Silk Performer section of the Introduction for details regarding TrueLog technology.
TrueLog files are only available when they are enabled in monitor settings. See Adding Monitors for details regarding enabling the writing of TrueLog files. Available TrueLog files are indicated with Download Files buttons. See Downloading TrueLog Files for details.