A launch configuration describes the way an application should be run or debugged. Some launch configurations apply to running and debugging, while some apply only to debugging. You can configure multiple launch configurations of the same, or different types, and you can give them meaningful names.
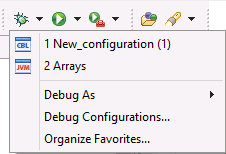
The most recently-used configurations are shown in the run and debug options on the toolbar. You can save launch configurations within a project, enabling you to share them between developers.
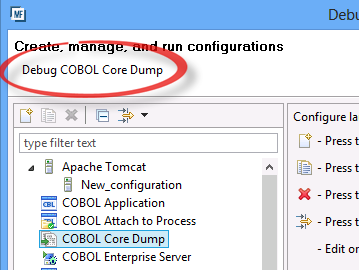
Click Run > Run Configurations or Debug > Debug Configurations - the dialog box that this opens enables you to manage the launch configurations. Click a type of configuration in the pane on the left-hand side of the dialog box - a description of the intended usage of the type is shown in the banner at the top.
The behavior of the Run and Debug toolbar buttons can also be configured in the IDE preferences - click Window > Preferences > Run/Debug > Launching page. The buttons can either repeat the last launch or launch the currently-selected resource.
Note that the key bindings used for common functions while debugging (such as Step and Continue) are different from those used in other IDEs. To quickly find the key binding, hover over the appropriate icon in the toolbar and the key binding is shown in the tooltip.
To share launch configurations - click Run > Run Configurations or Run > Debug Configurations, click the Common tab of the launch configuration and select the Shared file option.
Debugging your program opens the Debug perspective. You can step through code in the Debug view or use the Run to cursor feature to run from the current execution point to where you have placed the cursor.
The IDE offers a flexible debugging environment. When you debug the code you can step through it so that each line of the source is highlighted in turn as each statement is executed, showing the effect of each statement. You can interrupt execution to examine and change data items.
If you want to use just-in-time debugging, you can enable this using the Just in time debugging options section on the Micro Focus > COBOL > Debug page in the IDE preferences (click Window > Preferences).
Three types of COBOL breakpoint are available:
 - these are set against a line of code in the Procedure Division of the code and have properties which control when the breakpoint is activated.
 - these activate when a program of the given name is called.
 - these activate when a data item changes value.
Note that since execution breaks when the item has been changed, the cursor position will be on the statement after the statement that caused the data item to change value.
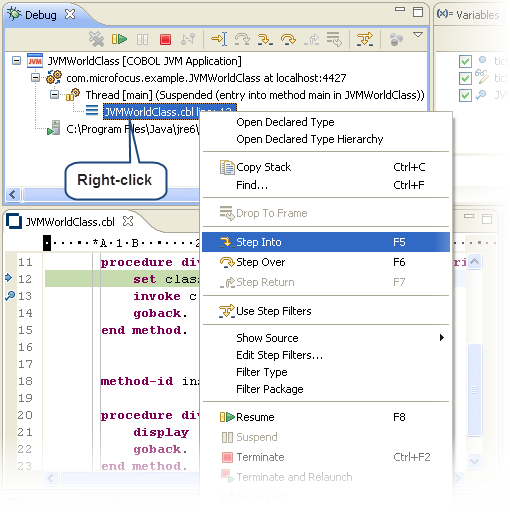
When debugging, the Debug view shows details of what is being debugged. Specifically, it shows a hierarchy where the first level is the launch configuration used, next is the built article that is being debugged (process), then the thread, and within that are the layers of performs and/or calls (stack frames).
A number of debugger functions are sensitive to the item that is selected in the Debug view (so as to cope with different scopes for variables, and the debugging of multiple threads), so if a function that you expect to be enabled is not, check which item is selected in the view. If you want to step, you need to have selected the first code line within the thread.
Selecting different stack frames controls which variables are shown in the variables view, and also switches the editor to the relevant line of code.
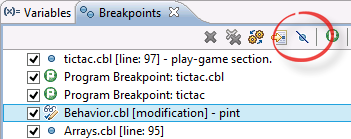
The Breakpoints view shows all the current breakpoints. From here you can disable all breakpoints with a single click.
The Expressions view shows the value of any variables that you add to it, as evaluated in the context of the current location selected in the Debug view.
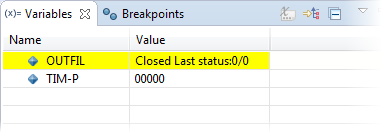
The Variables view shows the values of variables and file statuses of internal file names in use on the current or previous line of code. Those which have just changed in the last statement executed are highlighted. Again, the values displayed are sensitive to the current location selected in the Debug view.
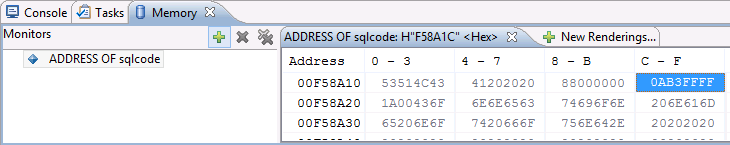
The Memory view shows the memory at any given address. Note that the Memory view is not shown by default. To display it, click Window > Show View > Other and type Memory to locate the view.
You can directly enter a numerical address or the name of a pointer variable. Alternatively, you can enter the name of a non-pointer variable and the memory of that variable is shown. Both ASCII and EBCDIC renderings are available for the memory along with the default hexadecimal rendering - click the New Renderings tab in the toolbar of the view to add new rendering.