Code Coverage HTML Reports
If running with code coverage does not produce an index report file in HTML format, TCIndex.htm automatically, you can generate that file manually from the filename.tcz results file as follows:
- Right-click the filename.tcz in your project and click Generate Coverage Report.
- If prompted, specify any options for generating the report and click
OK.
Visual COBOL creates the TCIndex.htm report file and opens it in the editor.
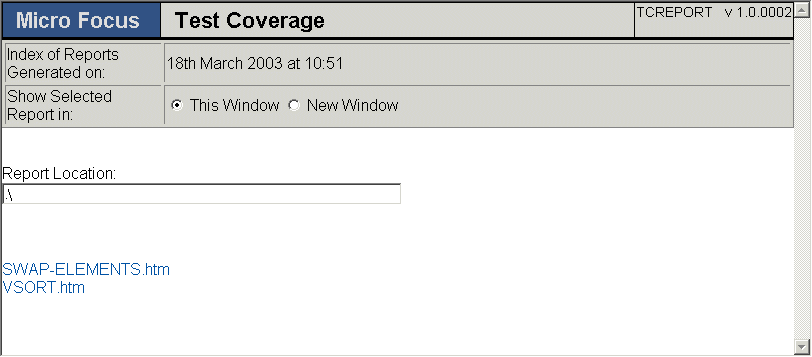
The picture below shows an example TCIndex.htm index report.

Click on of the links at the end of the TCIndex.htm file to view the individual reports.
The Contents section lists all of the programs in this report. If, in the IDE preferences you have specified to produce a single HTML report file or have had specified the COMBINE option when using Test Coverage from the command line, all the programs would be listed here, with the reports displayed further down the document. This report contains links to two report files: swap-elements.htm and vsort.htm. If you change the location of the report files, enter the new location in the Report Location field so that this report can locate them.
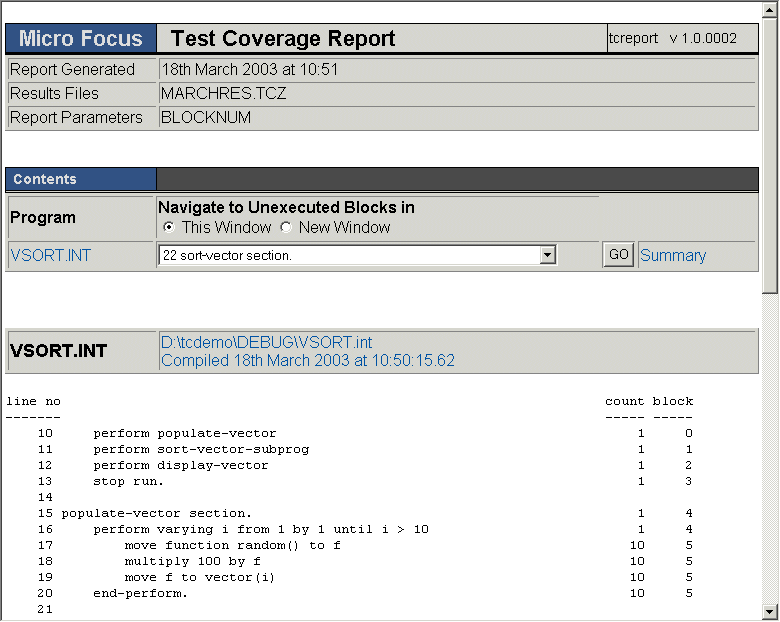
Below is the top of the report for aircode.htm. Report files saved as text contain exactly the same information, and differ only in containing links and formatting enabled by HTML. The explanation of the report contents given below also applies to text files.

The Contents section lists only one program - if we had specified that all the results were to be combined in this report, there could potentially be a large number of programs listed in the Contents section, and we would be able to click on a program name to jump straight to the section of the report that contained the results for that program.
On the row containing the name of the program, you can use the pull-down menu of Unexecuted Blocks and click GO to navigate directly to a specific unexecuted block in that program.
The rightmost column, block, shows the blocks of code in your program. Blocks can be thought of as a number of statements with no jumps: when you've executed one line, the next is executed. They are executed consecutively. Numbering starts from zero. The block starting on line 17 as shown above covers four lines of code, and then has a jump, which means the next block starts.
The other column on the right, count, shows how many times the block has been executed.
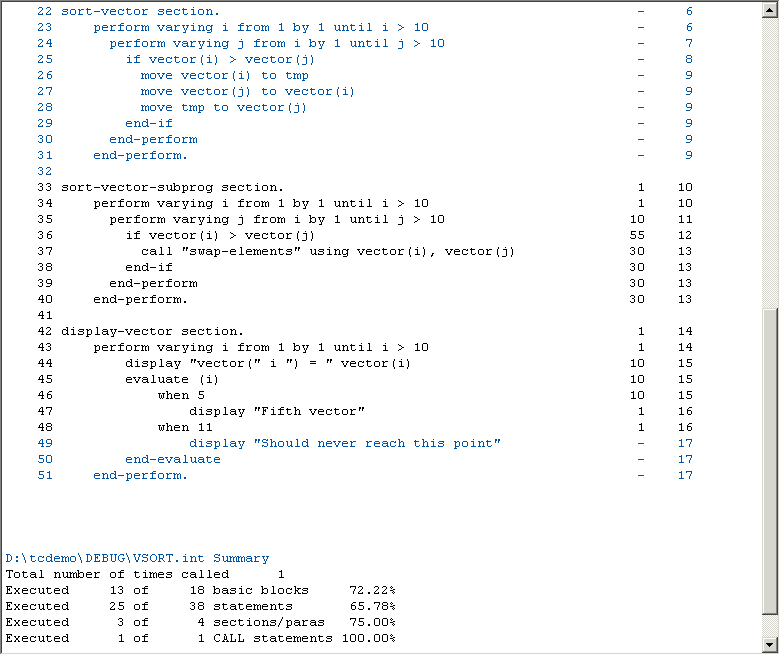
Below is the bottom of the report for aircode.htm.

The summary at the bottom shows the percentage of statements, blocks, sections and CALL statements which have been executed in your program.
In this example, the number of basic blocks shown tells you that there are five areas of code, thirteen statements and one section/paragraph which have not been executed.