Tracing Examples
By default, tracing is disabled for all components, so the absolute minimum you need to do to enable run-time system tracing is to specify an mftrace.level or mftrace.level.mf.rts entry in the configuration file. For example, if you have set the MFTRACE_CONFIG environment variable set as follows:
set MFTRACE_CONFIG=c:\mydir\ctf.cfg
and c:\mydir\ctf.cfg contains only the following entry:
mftrace.level=error
A trace file with an entry for event id 255 would be created by any process that generated a run-time system error. Note that you do not have to specify any properties for the mf.rts component for this event to be emitted; having the trace level set to error is enough.
In the examples that follow, the application mymain is used. This application comprises two programs: mymain.cbl and mysub.cbl that include the following code:
mymain.cbl:
       identification division.
       program-id. mymain.
       environment division.
       data division.
       working-storage section.
       01 my-var pic 9(9) external.
       procedure division.
       move 1 to my-var
       perform 5 times
         call 'mysub'
         add 1 to my-var
       end-perform

      cancel 'mysub'

      call 'myprog'
      goback.
mysub.cbl:
       identification division.
       program-id. mysub.
       environment division.
       data division.
       working-storage section.
       01 my-var pic 9(9) external.
       procedure division.
       display my-var
       goback.
When mymain is executed, run-time system error 173 (“Called program file not found in drive/directory”) occurs because of the call to myprog. The contents of a trace file generated using the configuration above look similar to the following:
1>  # -MFTRACE Text Emitter-
2>  # CommandLine      = mymain
3>  # ProcessId        = 17356
4>  # Date             = 2018/09/13
5>  # Time             = 15:12:27.993
6>  # Operating System = Windows 10.0  (Build 16299)
7>  # Computer Name    = NWZ-ZINO10
8>  # Format           = $(TIME) $(COMPONENT) $(EVENT) $(LEVEL)$(DATA)
9>  15:12:27.993 MF.RTS 255 3 173 1 "myprog"
| Information in Trace File | Pseudo-variable | Description |
|---|---|---|
| 11:54:42.875 | $(TIME) | The time the trace entry was output. |
| MF.RTS | $(COMPONENT) | The name of the component outputting the trace entry. MF.RTS indicates the run-time system. |
| 255 | $(EVENT) | The event identifier. Event identifier 255 for the mf.rts component indicates a run-time system error. |
| 3 | $(LEVEL) | The level of the error, based on the following values:
|
| 173 1 "myprog" | $(DATA) | Event-specific data. |
If you now rerun mymain after changing the statement in the configuration file to specify a trace level of INFO, as follows:
mftrace.level=info
the trace file created contains entries for the run-time system initialization and de-initialization events in addition to the run-time system error event. The trace file looks similar to the following:
# -MFTRACE Text Emitter-
# CommandLine      = mymain
# ProcessId        = 15364
# Date             = 2018/09/13
# Time             = 15:15:34.667
# Operating System = Windows 10.0  (Build 16299)
# Computer Name    = NWZ-ZINO10
# Format           = $(TIME) $(COMPONENT) $(EVENT) $(LEVEL)$(DATA)
15:15:34.667 MF.RTS 128 1
15:15:34.668 MF.RTS 74 1 "5.0.0.12"
15:15:34.670 MF.RTS 129 1
15:15:34.684 MF.RTS 255 3 173 1 "myprog"
15:15:36.403 MF.RTS 130 1
15:15:36.403 MF.RTS 131 1
To see which programs the application has invoked before the run-time system error occurred you need to set the PGM property. If you want to see where the programs have been loaded from and when they are canceled, you also need to set the PGMLOAD property, as follows:
mftrace.level=info
mftrace.comp.mf.rts#pgm=true
mftrace.comp.mf.rts#pgmload=true
When you rerun mymain, the trace file created contains additional entries for program load, entry, exit, and cancel events. The trace file looks similar to the following:
    # -MFTRACE Text Emitter-
    # CommandLine      = mymain
    # ProcessId        = 8012
    # Date             = 2018/09/13
    # Time             = 14:59:34.417
    # Operating System = Windows 10.0  (Build 16299)
    # Computer Name    = NWZ-ZINO10
    # Format           = $(TIME) $(COMPONENT) $(EVENT) $(LEVEL)$(DATA)
    14:59:34.417 MF.RTS 128 1
    14:59:34.419 MF.RTS 74 1 "5.0.0.12"
    14:59:34.420 MF.RTS 23 1 0 0 "vcruntime140" 00007FFDB8F00000
    14:59:34.420 MF.RTS 23 1 0 0 "api-ms-win-crt-conio-l1-1-0" 00007FFDBB890000
    14:59:34.420 MF.RTS 23 1 0 0 "api-ms-win-crt-convert-l1-1-0" 00007FFDBB890000
    14:59:34.420 MF.RTS 23 1 0 0 "api-ms-win-crt-environment-l1-1-0" 00007FFDBB890000
    14:59:34.420 MF.RTS 23 1 0 0 "api-ms-win-crt-filesystem-l1-1-0" 00007FFDBB890000
    14:59:34.420 MF.RTS 23 1 0 0 "api-ms-win-crt-heap-l1-1-0" 00007FFDBB890000
    14:59:34.420 MF.RTS 23 1 0 0 "api-ms-win-crt-locale-l1-1-0" 00007FFDBB890000
    14:59:34.421 MF.RTS 23 1 0 0 "api-ms-win-crt-math-l1-1-0" 00007FFDBB890000
    14:59:34.421 MF.RTS 23 1 0 0 "api-ms-win-crt-multibyte-l1-1-0" 00007FFDBB890000
    14:59:34.421 MF.RTS 23 1 0 0 "api-ms-win-crt-private-l1-1-0" 00007FFDBB890000
    14:59:34.421 MF.RTS 23 1 0 0 "api-ms-win-crt-process-l1-1-0" 00007FFDBB890000
    14:59:34.421 MF.RTS 23 1 0 0 "api-ms-win-crt-runtime-l1-1-0" 00007FFDBB890000
    14:59:34.421 MF.RTS 23 1 0 0 "api-ms-win-crt-stdio-l1-1-0" 00007FFDBB890000
    14:59:34.421 MF.RTS 23 1 0 0 "api-ms-win-crt-string-l1-1-0" 00007FFDBB890000
    14:59:34.421 MF.RTS 23 1 0 0 "api-ms-win-crt-time-l1-1-0" 00007FFDBB890000
    14:59:34.421 MF.RTS 23 1 0 0 "api-ms-win-crt-utility-l1-1-0" 00007FFDBB890000
    14:59:34.421 MF.RTS 129 1
    14:59:34.421 MF.RTS 19 1 0 0 "mymain" "" ""
    14:59:34.425 MF.RTS 6 1 17 0 "mymain" "MYMAIN"
    14:59:34.425 MF.RTS 19 1 0 0 "mysub" "" ""
    14:59:34.425 MF.RTS 6 1 17 0 "mysub" "MYSUB"
    14:59:34.426 MF.RTS 7 1 "mysub"
    14:59:34.426 MF.RTS 6 1 17 0 "mysub" "MYSUB"
    14:59:34.427 MF.RTS 7 1 "mysub"
    14:59:34.427 MF.RTS 6 1 17 0 "mysub" "MYSUB"
    14:59:34.428 MF.RTS 7 1 "mysub"
    14:59:34.428 MF.RTS 6 1 17 0 "mysub" "MYSUB"
    14:59:34.429 MF.RTS 7 1 "mysub"
    14:59:34.429 MF.RTS 6 1 17 0 "mysub" "MYSUB"
    14:59:34.429 MF.RTS 7 1 "mysub"
1>  14:59:34.429 MF.RTS 20 1 0 0 "mysub"
    14:59:34.429 MF.RTS 140 1 1
    14:59:34.429 MF.RTS 141 1 1
    14:59:34.434 MF.RTS 255 3 173 1 "myprog"
    14:59:34.435 MF.RTS 140 1 2 "
    Load error : file 'myprog'
    error code: 173, pc=0, call=1, seg=0
    173     Called program file not found in drive/directory "
    14:59:37.619 MF.RTS 141 1 2
    14:59:37.619 MF.RTS 130 1
    14:59:37.619 MF.RTS 140 1 0 0 0 127
    14:59:37.619 MF.RTS 141 1 0
    14:59:37.619 MF.RTS 140 1 3 0
2>  14:59:37.619 MF.RTS 20 1 0 0 "mymain"
    14:59:37.619 MF.RTS 140 1 1
    14:59:37.619 MF.RTS 141 1 1
    14:59:37.619 MF.RTS 21 1 0 0 "mymain"
    14:59:37.619 MF.RTS 141 1 3
    14:59:37.619 MF.RTS 140 1 0 0 128 255
    14:59:37.619 MF.RTS 141 1 0
    14:59:37.619 MF.RTS 140 1 4 0
    14:59:37.619 MF.RTS 21 1 0 0 "mysub"
    14:59:37.619 MF.RTS 141 1 4
    14:59:37.620 MF.RTS 131 1
The entries marked 1> and 2> show event type 20 (logical cancel): the Compiler embeds a cancel routine in all programs to close any files that the program may have opened. These cancel routines are implicitly invoked by the run-time system as part of a logical cancel operation.
To enable the tracing of all run-time system events with the exception of the memory management ones, you use the following configuration file entries:
mftrace.level = info
mftrace.comp.mf.rts#all=true
mftrace.comp.mf.rts#memory=false
When you rerun mymain, the trace file created contains additional entries for external data items. If you have compiled the programs with the AMODE directive, there would also be entries for each of the Mainframe Pointer Manager events. The trace file looks similar to the following:
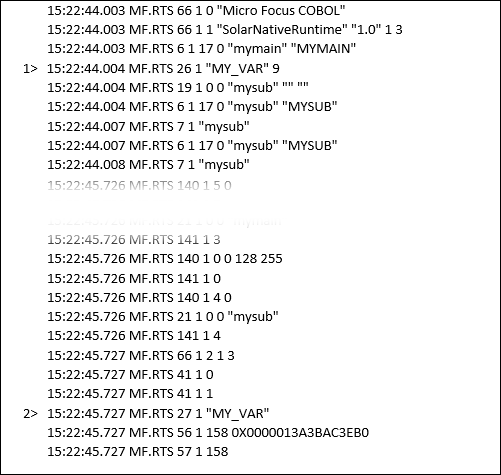
The entries marked 1> and 2> in the above excerpt show the start and end of the additional entries for an external data item.