This chapter describes the tools available from the Tools menu and how they can help you in your tasks.
Analysis tools provide powerful insights into how your source code applications function. They are accessed from the Tools menu and are named according to their functionality. The following tools are available for you to use during your analysis tasks:
The Shell tool is enabled on the User tab and is accessible from the Tools menu. It gives you an interactive command line interface for using REQL with Revolve, which enables you to perform specific administrative and analysis operations on the Revolve database. The REQL language is described in detail in the chapter Introduction to the REQL Language.
The Metrics tool calculates four statistical measures of complexity:
To change from one mode to another, use Options
![]() within the Metrics
window. The Metrics tool is set to Halstead by default. To change the default
mode, click the Metrics tab to change the settings that are
used when the Metrics tool starts its analysis. After you select a new mode,
the analysis is automatically performed when you click
OK.
within the Metrics
window. The Metrics tool is set to Halstead by default. To change the default
mode, click the Metrics tab to change the settings that are
used when the Metrics tool starts its analysis. After you select a new mode,
the analysis is automatically performed when you click
OK.
The Halstead metric mode uses four numbers to calculate the estimated length of each program. These numbers are the total number of operator occurrences (N1), the total number of operand occurrences (N2), the number of distinct operators (n1), and the number of distinct operands (n2). With these numbers, Halstead estimates the program length to be:
N=N1 + N2
The volume to be:
V=N log2 (n1 + n2)
The McCabe metric mode calculates the cyclomatic, extended, and essential complexity of each paragraph and program. These numbers represent the number of logical paths through the source code.
The McClure metric mode calculates complexity for each paragraph and program as the number of conditionals plus the number of unique operands used in the conditionals.
The Statistics metrics mode displays the number of lines and statements in each paragraph and program.
Use the Function Point Analysis tool to measure the complexity of your project.
The implementation of Function Point Analysis is based on the International Function Point Users Group's (IFPUG's) 4.1 function point analysis definition.
Note: We recommend that you select Project > Complete before opening the Function Point Analysis tool, to provide any missing information.
The FPA Options
![]() enable you to define
weighting factors that adjust the parameters of the Function Point Analysis. A
numerical value is determined based on the designated weight of each function
where 0 represents no influence and 5 represents strong influence. You can
change the defaults for this dialog by clicking Utilities
> Tools/ Diagrams Options and the Function Point
Analysis tab. Using Options within the Function
Point Analysis window changes the settings only for that particular
session.
enable you to define
weighting factors that adjust the parameters of the Function Point Analysis. A
numerical value is determined based on the designated weight of each function
where 0 represents no influence and 5 represents strong influence. You can
change the defaults for this dialog by clicking Utilities
> Tools/ Diagrams Options and the Function Point
Analysis tab. Using Options within the Function
Point Analysis window changes the settings only for that particular
session.
Function Point Analysis (FPA) first identifies and organizes the system's business functions into five groups:
Note: FPA classifies screen accesses as either inputs or outputs. Data files are classified as ILF or EIF. The distinction is made in that ILFs are written to and EIFs are not.
Then each business function is classified and weighted by its level of complexity (low, average, or high). Finally, the numbers are totalled to establish the complexity of your project. The higher the total is the more complex the project is. The evaluation process can be viewed in the Function Point Analysis window.
Classifications
![]() opens the File Types
dialog, to allow you to specifically identify file types. By selecting an item
and clicking the specific button, elements can be designated as inquiries,
inputs, outputs, ILF, or EIF. If an element is unused it can be tagged Unused.
opens the File Types
dialog, to allow you to specifically identify file types. By selecting an item
and clicking the specific button, elements can be designated as inquiries,
inputs, outputs, ILF, or EIF. If an element is unused it can be tagged Unused.
The Annotation tool allows persistent documents or notes to be created that contain references to elements of source code as well as user-defined information about those elements. Annotations are useful:
Using annotations is an excellent way to document source code changes as well as performing project management tasks. Use the Annotation tool to create, manage, research, or delete annotations. Each annotation includes a title, description, status, and list of related elements. These documents or notes will exist within a Revolve project until they are explicitly deleted. The Annotation tool is accessed from the Tools menu or from the speed menu.
The Annotation tool locates annotations based on certain parameters defined in the Edit Annotation dialog. Use the pull down list box to select the parameter that is to be used to find a specific annotation. Enter the name or naming convention in the Match edit field and click Match. Annotations that match the criteria are displayed in the information window.
When you add elements to an annotation, you do not have to add
them in the order they occur in the source. To organize your annotations, use
the Sort
![]() function. It orders
connected elements in two ways.
function. It orders
connected elements in two ways.
Sorting elements according to the order they were added preserves any
existing process used to create the annotation. Sorting by location in the
source file enables you to order connected elements by their occurrence in the
source code. This is especially useful when you want to organize elements that
were randomly added to the annotation. After clicking Sort,
click Refresh
![]() , and then expand the
connected elements folder to view the changes.
, and then expand the
connected elements folder to view the changes.
The Edit Annotation dialog is invoked with Edit
Annotation ![]() .
.
The following information is available for each annotation:
| Field: | Definition: |
|---|---|
| Title: |
Names the annotation. |
| Date: |
Indicates the date the annotation was created. This field can not be changed. |
| By: |
Displays the user name assigned to the person who created the annotation. The default user name is taken from the value specified in the User Name field of the Utilities > Options > User tab. |
| Status: |
Monitors the status of annotations that are used for source code changes. |
|
To: |
Identifies the intended recipient. |
| Description: |
Describes the annotation. Descriptions should be limited to 8,000 bytes (8K). |
| Associated Elements: |
Lists the other elements that are associated with this annotation. This is a concise way of associating related elements to a single annotation. Elements for this list can be selected by using tools, views, and information browsers. To add all currently highlighted elements, click Add Highlighted. To delete an element, select the element in the Associated Elements list and press Remove. |
| Element Description: |
Describes selected elements. Each element in the Associated Elements list can have an optional description associated with it. As the current selection in the Associated Element list is changed, the Element Description is updated with the corresponding description. |
To save changes to the annotation, click OK. To cancel changes, click Cancel.
Information can be added to annotations from the Annotation tool or with Capture Results. If an annotation is currently being edited in an Edit Annotation window, the elements are added to that annotation, otherwise the Add element to annotation window is displayed. This enables you to create a new annotation or lookup an existing one.
Annotations in shareable projects have two classifications:
When you create an annotation in a shareable project it is Public by default. To move it to Private:
To make it Public again, click Move
Annotation to Public
![]() . If these buttons
are not displayed in the Annotation tool, close and restart
Revolve. A single annotation cannot be public and private
simultaneously.
. If these buttons
are not displayed in the Annotation tool, close and restart
Revolve. A single annotation cannot be public and private
simultaneously.
Public annotations are stored by default in the same directory as the project file (.prj). You can change this location by clicking Utilities > Options and the Project tab. Note that this directory must be accessible to all users of a project. Private annotations are stored according to the setting of the Private Annotation Directories setting on the Directories tab in Utilities > Options. We recommend that the Private and Public annotation directories be different.
The Scripts tool enables you to automate specific tasks in Revolve. Scripts are organized according to their general purpose in project analysis and operation. They are categorized as follows:
Expand each folder to view the scripts it contains. To run a script,
select it and click ![]() Run. Often specific project components must be selected for
a script to execute its designed function. The Choose Components dialog enables
you to assign a scope to the script, applying the scripting procedure to
selected project items.
Run. Often specific project components must be selected for
a script to execute its designed function. The Choose Components dialog enables
you to assign a scope to the script, applying the scripting procedure to
selected project items.
Shows records used in I-O against batch files and the copybooks containing the record layouts. Records moved to or from I-O records are included in the record list.
Shows records used in I-O for CICS datasets and copybooks containing the record layouts. Records to which I-O records are moved are included in the record list for a dataset.
Shows files accessed by their procedure.
Shows files accessed by programs. Records displayed for program/file are records READ INTO or WRITTEN - REWRITTEN FROM, as well as the data record defined in the File Definition (FD).
Shows procedures accessing files by file.
Shows programs accessing files by file.
Shows data files in your project that are written to by JCL job executed programs.
Finds variables whose names are the same but whose PIC clauses define different types or sizes.
Reports on parser-generated errors in user-specified project components.
Reports on parser-generated errors and warnings in user-specified project components.
Returns all discrepancies discovered during project parsing.
Reports on parser-generated file-not-found warnings in user-specified project components. File-not-found warnings are most likely copybooks or proclibs that have not been added to the project before parsing.
Reports on the notices that occur during the parsing process. Notices are the least severe of the parser-generated problems.
Reports on parser-generated syntax warnings in user-specified project components.
Reports on parser-generated Warnings in user-specified project components.
Shows all modules by type that have been added to the Project Manager where duplicate names exist in multiple directories. This script is designed to show invalid conditions that exist in the source code, so that problems can be resolved.
Shows programs in your project that do not contain source code and other load modules that are affected. Results are organized according to the source-less programs and the affected programs.
The Project Management scripts are provided as
templates that you can customize to automate some of your common administrative
tasks. Select a script and click View Source Code
![]() to view its source.
These templates are working scripts that you can actually execute if your
directory structure adheres to that used in the script, and if the sample
source code that was included in the installation is located in
samples\sampleapp.
to view its source.
These templates are working scripts that you can actually execute if your
directory structure adheres to that used in the script, and if the sample
source code that was included in the installation is located in
samples\sampleapp.
Customize these scripts according to your project needs. You can
review the source and replace existing parameters with some of your project's
parameters. For example, in the Template for creating a new project by
explicitly adding sources, substitute the existing paths with your
system paths and file names. Once you are satisfied with the settings, save the
script. Then click Compile
![]() . Once the script has
compiled it's ready to be Run
. Once the script has
compiled it's ready to be Run
![]() . For information on
language constructs and functions specific to project administration, see
Automating Project
Management.
. For information on
language constructs and functions specific to project administration, see
Automating Project
Management.
Customize this script to create a new project and add components. Substitute existing settings with your system parameters.
Customize this script to set up search directories for your project,
where Revolve loads components of specified types from specified
directories. These search directories are referenced for subsequent
Makes
![]() and updates.
Substitute existing settings with your system and project parameters.
and updates.
Substitute existing settings with your system and project parameters.
Customize this script to automate project Makes
![]() . Substitute existing
settings with your project parameters.
. Substitute existing
settings with your project parameters.
Opens a Choose dialog that displays all the copybooks referenced in the project. Select a copybook or copybooks (Ctrl key and left mouse button) and click OK. The script describes all variables referenced in the copybook(s) and their attributes.
If nothing is returned for a selected copybook, check to see if the copybook is loaded properly. An easy way to find problem files is with the Parsing Problems scripts.
Reports on I-O Records. Records are 01-level input/output records.
Reports on non-I-O records. Records cannot be input or output (exclude all records defined in Comm Area, FD, and Linkage sections) and must be 01 group level data elements.
Groups I-O records by size/name.
Groups secondary (non-I-O) records by size/name.
Reports on usage of hard-coded literals by program.
Identifies program source that violates the following indentation rule:
Reports on MOVE statements that result in truncation. Truncation is a result of data elements being moved from a field of a certain size to one of smaller size.
Returns MFS screen files that have duplicate FMT names.
Returns a list of copybooks in the project with duplicate names.
Determines greatest number levels of nested IF statements within the selected programs. Reports on and highlights all IF statements exceeding user specified maximum.
Reports on variable redefines, for which the redefining and redefined variables are of different lengths.
Generates a report of all COBOL programs whose program IDs differ from their member names. The discrepancy between program IDs and their member names may cause problems in other scripts, resulting in programs being out of order and duplicated in output reports. This script exposes such occurrences.
Reports on Variable Names whose length exceeds a user defined maximum within the selected programs.
Reports on copybooks included in programs whose variable definitions are not referenced or whose procedural logic is not executed.
Reports on paragraphs whose statements are not executed.
Reports on the unused procedural logic within the program selected in the Choose dialog.
Provides information about variables that are not explicitly used in the loaded project. Please note that some returned fields may not be removed from the project because they are part of redefines, structure definitions, or copybook members that cannot be modified.
Invokes a Choose Components dialog where you need to specify the components whose source files you want to copy to another location. Click OK. In the Prompt dialog, enter the path to the drive or directory where the files should be copied.
Counts logical and physical line numbers for all project modules. It will generate four columns:
| Column | Indicates |
|---|---|
| Module Name: | Specifies the project module's name. |
| Logical: | Refers to the total number of lines in a module, including imported elements (copybooks, procs, et cetera.). |
| Physical: | Refers to the actual line count in the module. Imported elements (copybooks, procs, et cetera.) are not included. |
| Imports: | Lists the numbers of lines brought into the module through imported elements (copybooks, procs, et cetera.). |
Counts files and lines that need to be metered, so you can calculate the size of the usage counter to purchase. It will generate a list of program files, copybooks and includes, and tell you both how many files could be metered and how many files and lines need to be metered. See the chapter Metering Lines of Code for more information.
Allows you to utilize the import translations of one project in another one that requires the same translations. The default name and location of the script that is generated is c:\buildimp.rqs. When you use the script Rebuild Import Translations it will ask you for the compiled version of this file (.rqc).
Creates a script that is used to rebuild the active project (including Complete Project and Copybook Translation information).
Creates a list of source files which are not used in the project, but which have been found in directories contained in the project.
Opens Screen views associated with the selected item. To select a project component, right-click on it in a Revolve information window and choose Select from the speed menu. The selected component's name is displayed at the bottom of the Revolve desktop.
If the selected item is a paragraph, printing the "text content" of a paragraph will print the whole paragraph.
If your IMS GEN has load modules and PDBs that are not referenced elsewhere, this script will remove them.
If your CSD report has load modules that are not referenced, this script will remove them.
Displays the filename, record name and location of batch files, in an RSP Viewer. The RSP Viewer is embedded in a child window, and offers a split-screen source view.
Displays any parser-generated file-not-found warnings in an RSP Viewer. The RSP Viewer is embedded in a child window, and offers a split-screen source view. File-not-found warnings are most likely to be copybooks or proclibs that have not been added to the project before parsing.
Displays any parser-generated Warnings in user-specified project components in an RSP Viewer. The RSP Viewer is embedded in a child window, and offers a split-screen source view.
Displays the files in your project, by type, with any files they import, in an RSP Viewer. The RSP Viewer is embedded in a child window, and offers a split-screen source view.
Impacts occur when data elements refer or relate to one another in a project through moves, redefines, conditionals, arithmetic operations, group relations, parameter passing, copybooks, references to files, and references to screens. When one item is changed in an application, it can affect other items, causing inconsistencies and even system failure.
The threat of data impacts poses a major problem when you consider the task of system maintenance and specifically making source code modifications. For example, if you modify just one data item, it might impact many different source components in many different areas of your system. To guarantee source code integrity, the Impact Analysis features enable you to identify all locations in your system where specific data elements have impacts. Once you've located the impacts, you can modify source code accordingly to alleviate impact problems that may arise when you apply modifications to your actual system. The benefits of using Impact Analysis are:
We recommend that you select Project > Complete before opening the Impact Analysis tool, to provide Revolve with any missing information.
The first step in impact analysis is to define a list of data elements that might be impacted or cause impacts. This list of impact candidates is used as the starting point for the impact trace. A starting point can be any data element that is scheduled to be or has been modified or edited. Also, a starting point must be located in a loaded, up-to-date project file.
The Impact Analysis tool locates and loads starting points according to the naming criteria you specify in the Match edit field. Specify an element's exact name or use wildcards to define naming patterns for many elements that use similar naming conventions.
Starting points must be classified as variables, BMS or MFS fields, or data files. The Match edit bar contains a pull down list box that enables you to specify the type of item to find. For example, to load all project variables whose names begin with WS, select Variable from the pull-down list box, enter WS* into the Match edit field, and click Match. The Impact Analysis information window fills with all project variables with names like WS-TABLES and WS-KEY.
When you click the Match button, Impact Analysis searches the project database and identifies all source components that comply with your name and type criteria. Matched components are displayed in the information window. These are your starting points for impact tracing. The total number of starting points is displayed on the Match edit bar. Impact Analysis for the Assembler Extension uses variables as starting points and traces through direct variable manipulations in MOVE statements.
When you have a list of starting points that are considered impact candidates, you can edit, remove, or exclude items based on your analysis needs.
To do this, select items that you want to exclude in the
information window and click Exclude Selected
![]() . These items are
placed on the Exclusions list and are withheld from the impact trace. Excluded
items are displayed in the impact trace results with an E
flag.
. These items are
placed on the Exclusions list and are withheld from the impact trace. Excluded
items are displayed in the impact trace results with an E
flag.
In a large, complicated project, it is essential that you be able to
control the direction and flow of the impact trace. Otherwise, you would be
sifting through unneeded and unimportant impact trace information. The
Tracing tab on the Impact Analysis Options
![]() dialog enables you
to define the parameters for tracing impacts from your starting points through
the project. There are four categories of options: Impact
Through, Prune, Logical Levels to
Expand, and Enable Code Flow Analysis.
dialog enables you
to define the parameters for tracing impacts from your starting points through
the project. There are four categories of options: Impact
Through, Prune, Logical Levels to
Expand, and Enable Code Flow Analysis.
The Impact Through options control which circumstances are considered to cause the impact of one variable on another. The options enable you to configure the impact trace to return specific information on impacts occurring in certain project modules. You direct the path of impact tracing through source code components, like conditions, literals, arithmetics, copybooks, data files and executables. With this control you can trace impacts through points of interest as well as known problem areas in your source code.
All options are checked by default, except Children.
In the sections below, all Impact Through options code examples are located in your samples\impact directory, in the files prog1.cbl and prog2.cbl. Each example is preceded by a corresponding named label. For example, 01-IT-CONDITIONS for the Conditions option.
The Impact Through options are:
IF A=B DISPLAY 'EQUAL'
then B is returned as an impact of A.
COMPUTE D=E*F+G
then variables D, F, and G are included in the analysis.
01 B PIC X.
01 BB REDEFINES B PIC X.
01 C PIC X.

MOVE BB TO C
then BB and consequently C will also be included in the analysis.
* copybook COPY1
01  C1-A PIC X.

* program PROG-1
01 A PIC X.
COPY COPY1.

MOVE A to C1-A.

* program PROG-2
01 P2-B PIC X.
COPY COPY1.

MOVE C1-A to P2-B
then the analysis will include the variable C1-A in PROG-1 and PROG-2 and the variable P2-B in PROG-2. This is because C1-A appears in a copybook and PROG-2 uses the same copybook.
01 W PIC XX.
01 X.
    05 X-1 PIC X.
    05 X-2 PIC X.
01 Y PIC XX.
01 Z PIC X.

MOVE W TO X
MOVE X TO Y
MOVE X-1 TO Z
with this option unchecked, the analysis will only include the variables W, X, and Y. If checked, then the children X-1 and X-2, and the variable Z will be included in the output.
MOVE A TO B
MOVE B TO C
MOVE D TO C
MOVE C TO E
then A will be included in the impact chain because the first MOVE statement modifies B with the value of A. All the variables will be included in the output.
If this option is not checked and you start impact tracing with the variable B, then only B, C, and E will be included in the output. The logic that applies, is as follows:
You can think of checking the Modifications option as having the effect of tracing in a backward direction only.
MOVE A TO B
MOVE B TO C
MOVE D TO C
MOVE C TO E
E will be included in the impact chain because it is referenced by C. All the variables will be included in the output.
If this option is not checked and you start impact tracing with the variable C, then only A, B, C, and D will be included in the output. The logic that applies, is as follows:
You can think of checking the References option as having the effect of tracing in a forward direction only.
There are some situations in which the Impact Analysis tool returns information that probably does not represent a true impact. The Prune options are built-in rules to remove these items. Normally, you will want to prune these items from the impact analysis output. For this reason, the default state for all these options is checked. This means that the built-in pruning rules will apply. If, in unusual circumstances, you do want to include any of these items, you can suppress pruning by unchecking one or more of these options.
In the sections below, all Prune options code examples are located in your samples\impact directory, in the files PROG1.CBL and PROG2.CBL. Each example is preceded by a corresponding named label. For example, 08-PR-SUSPECTLITERAL for the Suspect Literal option.
The Prune options are:
01 SUSPECT-LITERAL PIC X VALUE '1'.
01 A PIC X.
01 B PIC X
01 C PIC X
...
MOVE SUSPECT-LITERAL TO A.
IF B = SUSPECT-LITERAL
     MOVE B TO C
END-IF
then SUSPECT-LITERAL will be treated as a literal. This is because SUSPECT-LITERAL is initialized with a value and is not modified. The output of the impact trace will include A and SUSPECT-LITERAL, because SUSPECT-LITERAL effects the value of A.
If this option is not checked, the output will include A, SUSPECT-LITERAL, B, and C. B and C will be included as SUSPECT-LITERAL will be treated as if it were an ordinary variable.
PROGRAM-ID. PROG1.

FD RPT-FILE.
01 RPT-REC.
   05 RR-1 PIC X.
   05 RR-2 PIC X.

WORKING-STORAGE SECTION.
01 A PIC X.

MOVE A TO RR-1.
WRITE RPT-REC.

PROGRAM-ID. PROG2.

FD RPT-FILE2.
01 RPT-REC2.
   05 RR2-1 PIC X.
   05 RR2-2 PIC X.

WORKING-STORAGE SECTION.
01 B PIC X.

MOVE B TO RR-1.
WRITE RPT-REC.
then A will not be traced into PROG2. This is because the file is only written by the application. If this option is not checked, A will be traced into PROG2 and RPT-REC2 and RR2-1 will appear in the output.
* Copy book COPYCBB.
01 BUF-IN-CB PIC X(20).

* Program PROG1
01 S PIC X.
01 T PIC X
   COPY COPYCBB.

MOVE S to BUF-IN-CB
MOVE BUF-IN-CB TO T.

* Program PROG2
01 A-2 PIC X.
01 B-2 PIC X.
   COPY COPY1.

MOVE A-2 to BUF-IN-CB
MOVE BUF-IN-CB TO B-2.
then the output will include S, T, and BUF-IN-CB. If this item is unchecked, variable S will also be traced into PROG2, because PROG2 also uses copybook COPCBB. Therefore, the output will also include A-2, B-2, and BUF-IN-CB in PROG2.
Note: If the copybook contains a synonym for the item being traced and the Impact Through Copybooks option is checked, it will be traced regardless of this setting.
PROGRAM-ID. PROG1.

WORKING-STORAGE SECTION.
01 A PIC X.
01 PARM-OUT PIC X(10).

MOVE A TO PARM-OUT.
CALL 'PROG2' USING PARM-OUT.

PROGRAM-ID. PROG2.

LINKAGE SECTION.
01 PARM-IN PIC X(25).
PROCEDURE DIVISION USING PARM-IN.
then the output will not include an impact on PARM-IN in PROG2.
This prune option is more useful in eliminating output when the program uses a dynamic, rather than static, CALL statement. In this case, Impact Analysis traces the call for each possible value that it can determine for the variable. For example, if you start with the variable A and your program contains the following statements:
01 CALL-PROG PIC X(10).
01 PROG2-PARM PIC X(10).
01 PROG3-PARM PIC X(20).

IF A = SPACES
   MOVE 'PROG2' TO CALL-PROG
ELSE
   MOVE 'PROG3' TO CALL-PROG
END-IF

MOVE A TO PROG2-PARM

IF A <> 'XX'
   CALL CALL-PROG USING PROG2-PARM
ELSE
   CALL CALL-PROG USING PROG3-PARM
END-IF

PROGRAM-ID. PROG3.

LINKAGE SECTION.
01 PROG3-PARM-IN PIC X(20).
PROCEDURE DIVISION USING PROG3-PARM-IN.
then impact analysis will determine that PROG2-PARM is impacted and examine the first CALL statement. CALL-PROG can contain either PROG2 or PROG3, so the analysis will attempt to trace into both PROG2 and PROG3. The mismatch between the size of PROG2-PARM and the parameter received by PROG3 will be detected and the impact will not be traced into PROG3. If this option is unchecked, the impact will be traced into PROG3.
DATA DIVISION.
FILE SECTION.
FD  IN-FILE.
01  REC-1.
   05 R1-F1 PIC X.
   05 R1-F2 PIC X.
   05 R1-F3 PIC X.
01 REC-2.
   05 R2-F1 PIC X.
   05 R2-F2 PIC X.
   05 R2-F3 PIC X.
WORKING-STORAGE SECTION.
01 U PIC X.
01 WS-REC1.
   05 WS-R1-F1 PIC X.
   05 WS-R1-F2 PIC X.
   05 WS-R1-F3 PIC X.
01 WS-REC-2 REDEFINES WS-REC1.
   05 WS-R2-F1 PIC X.
   05 WS-R2-F2 PIC X.
   05 WS-R2-F3 PIC X.

READ IN-FILE INTO WS-REC1
MOVE WS-R1-F1 TO U.
then the output will include U, WS-R1-F1, and R1-F1. WS-R2-F1 and R2-F1 will not be included as WS-REC-2 explicitly redefines the file buffer WS-REC-1 and REC-2 implicitly redefines the buffer REC-1.
01 J PIC X.
01 K PIC X.
01 BUF PIC X(10).
01 BUF-REDEF REDEFINES BUF PIC X(10).

MOVE J TO BUF
MOVE BUF-REDEF TO K.
then the output will include J and BUF. If you run Impact Analysis with this option unchecked, the output will also include BUF-REDEF and K.
PROGRAM-ID. PROG1.

01 PARM-1 PIC XXX.
01 PARM-1A PIC X.
01 V PIC XX.

MOVE V TO PARM-1
CALL 'NOTEXIST' USING PARM-1 PARM-1A

PROGRAM-ID. PROG2.

01 PARM-2 PIC XXX.
01 PARM-2A PIC X.
01 W PIC XX.

MOVE W TO PARM-2
CALL 'NOTEXIST' USING PARM-2 PARM-2A
Impact Analysis will not attempt to trace through the call to the non-existent program NOTEXIST and the output will only include V and PARM-1. If this option is not checked, the output will also include PARM-2 and W.
01  G1.
   05 G1-A PIC XX.
   05 G1-B PIC XX.
   05 G1-C PIC XX.
01  G2.
   05 G2-A1 PIC X.
   05 G2-A2 PIC X.
   05 G2-B PIC XX.
   05 G2-C PIC XX.
01 E1 PIC XX.
01 E2 PIC XX.

MOVE E1 TO G1-B
MOVE G1 TO G2.
MOVE G2-B TO E2.
then the output will include E1, G1-B, G2-B, and E2. Even though the data value moves through the two intermediary buffers, G1 and G2, the analysis recognizes that G2-B in the group item G2 is the same size and at the same location as the item G1-B in group item G1.
The Logical Levels to Expand option specifies the maximum number of logical levels to expand from a starting point. This feature is useful when you want to step through an impact one logical level at a time.
Entering "0" expands through all logical levels.
The Enable Code Flow Analysis option determines whether Impact Analysis considers only data movement in a program or if it considers the sequence of statements. By default, this option is unchecked and only data movement is considered. This can occasionally lead to unexpected results. For example, if your starting point is the variable A and your program contains the following statements:
MOVE B TO C
MOVE A TO B
then the output will include A, B, and C. Even though the MOVE B to C statement occurs before the MOVE A to B statement, C is included because the sequence of statements is not considered. This is fine for purposes such as field expansion but not for tracing data flow. If you check the Enable Code Flow Analysis option, Impact Analysis will consider the order of program statements and C will not be included in the output. However, if the above sequence is included in a loop, Code Flow Analysis correctly recognizes that the first MOVE can be executed after the second. C will then be included in the output.
If you check the Enable Code Flow Analysis option, you must select a variable usage as opposed to the variable's definition as a starting point for Code Flow tracing.
Note: Running Impact Analysis with Code Flow Analysis enabled can be much slower than running it with this option unchecked.
After you are satisfied with your impact candidates and tracing options you're ready to perform the impact trace. Impact tracing begins at each starting point in the source code and traces through each element encountered. Along the way impacts with other project elements are determined, identified, and returned in the results.
To initiate impact tracing, click Impact Tracing
![]() . By default, the
Impact Analysis tool displays all results by name. You can change the display
of impact information. See
Display
Options.
. By default, the
Impact Analysis tool displays all results by name. You can change the display
of impact information. See
Display
Options.
Once you have performed an impact trace, expand the displayed folders
to view the chain of events that led to each impact. The trace chain of events
are displayed as leaves
![]() . Each leaf details a
step in the data movement leading up to the impact of an item with the impact
candidate.
. Each leaf details a
step in the data movement leading up to the impact of an item with the impact
candidate.
During impact tracing the Impact Analysis tool analyzes data for all project entities that are affected when the variable, BMS field, or MFS field is modified. Impacts are categorized into the following types:
The Impact Analysis tool gives you various modes in which to view the
results of an impact trace. Click Options...
![]() and click the
Display tab. The options provided enable you to have
complete control over the display of the impact trace results. It is important
to pay attention to the starting points that you use to identify impacts. Your
results can be displayed according to those starting points or by the items
that are impacted.
and click the
Display tab. The options provided enable you to have
complete control over the display of the impact trace results. It is important
to pay attention to the starting points that you use to identify impacts. Your
results can be displayed according to those starting points or by the items
that are impacted.
The Impact Analysis tool enables you to save the results of an impact
trace. The impact analysis is saved to a location that you define in the Save
dialog that is invoked when you click Save Impact Analysis
![]() . The file is given
an .ia extension. To open the impact analysis file later,
click Load Impact Analysis
. The file is given
an .ia extension. To open the impact analysis file later,
click Load Impact Analysis
![]() .
.
Advanced text search allows you to specify the exact text, or text pattern, you want to search for, in files and directories which you also specify. You can refine this by specifying text, files and directories to be ignored in your search.
The six tabs on the Advanced Text Search dialog allow you to enter your precise requirements. They are:
In this tab, you can specify multiple project directories, and subdirectories if required, to include in the scope of your search. By default, this tab is populated with directories containing source files used in the current project.
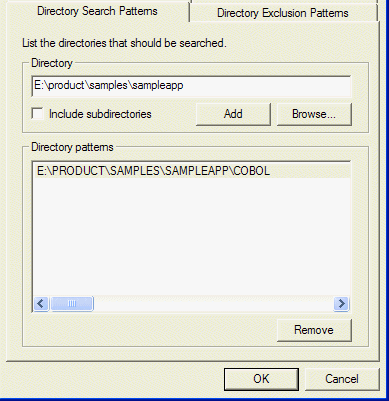
Figure 4-1: Directory Search Pattern tab
This works in the same way as the Directory Search Patterns, except this specifies directories and subdirectories to be ignored in your search.
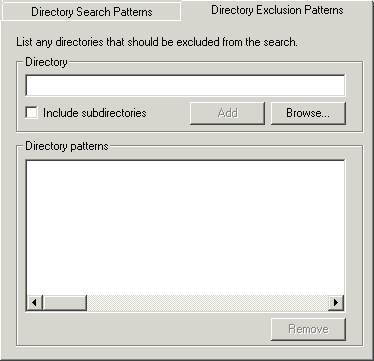
Figure 4-2: Directory Exclusion Patterns tab
In this tab, you can specify the filename extensions to include in the scope of your search. You do this by selecting from a file types list, supported extensions list, or by adding your own filename patterns. The following pattern matching is used:
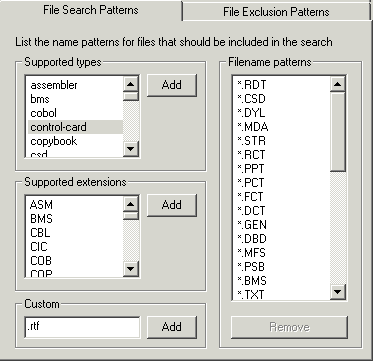
Figure 4-3: File Search Patterns tab
This works in the same way as the File Search Patterns, except this specifies filename extensions to be ignored in your search.
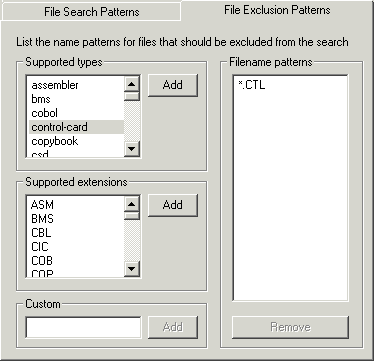
Figure 4-4: File Exclusion Patterns tab
In this tab, you can specify multiple text patterns to include in the scope of your search. You can use the wildcard character (*) to indicate one or more characters, or the question mark (?) to specify one character, and select whether to make your search case sensitive. You can save your text pattern as a .mpt file, or load an existing text pattern.
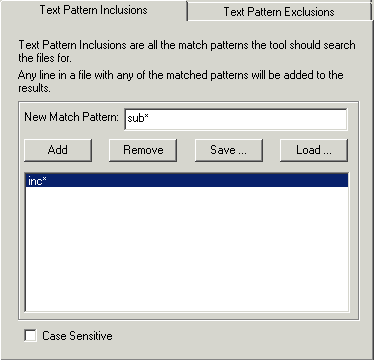
Figure 4-5: Text Pattern Inclusions tab
This works in the same way as the Text Pattern Inclusion, except this specifies patterns to be ignored in your search. It works by first searching for the patterns you specified in the Text Pattern Inclusion tab, and then removes from the results any patterns specified in this tab.
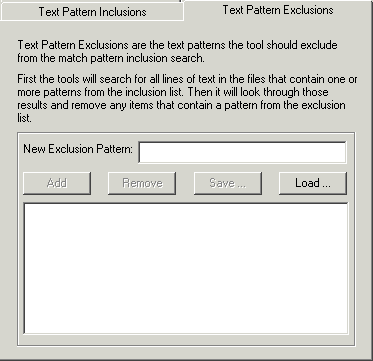
Figure 4-6: Text Pattern Exclusions tab
The Advanced Text Search Viewer displays all files with matches based on your requirements. Click the plus sign (+) in front of the filename to display the specific lines of code containing your text pattern match. Results are shown in bold italics. You can use the Split Screen Viewer to examine the results more closely. You can view an item that is found by the Advanced Text Search in a tool or browser only if that item has been added to the current project.
The Source view creates a logical view showing all the integrated files that comprise a module. For example, for a COBOL program, the copybooks and include files are interleaved in the main source file. As a further example, for JCL, a logical view that integrates all the proclibs with the main job is shown. The Source view displays the source code as it would appear in its source file format. The overview window runs along the left side of the view and provides a representation of the source file. The selected item's location appears as a horizontal bar in the overview window. Highlighted items will also be displayed in their appropriate color in the overview window.
When the Source view is invoked from the Tools menu, an Open Source dialog appears. To find a specific source file, enter the file name into the Match edit box and click Match. Or use the list to find and select multiple files for display in the view. The Select All !button selects all of the items in the scroll-able list and opens Source views for each file.
Copyright © 2006 Micro Focus (IP) Ltd. All rights reserved.