Charts
Charts track volume, changes, and errors. Each item is denoted by a specific colored line:
- Green: denotes volume, indicating the quantity of items read.
- Blue: denotes changes, indicating the quantity of items modified.
- Red: denotes errors, indicating failed changes.
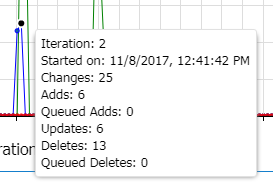
Hover over the a data point to view detailed information.