Debugging PL/I Programs Containing Macro Code
Most users of simple PL/I macros prefer to debug a macro as if it were executable code within the original source, even though it can generate 0-n lines of underlying PL/I statements. To address this, CodeWatch provides a WYSIWYD (What You See Is What You Debug) experience where a single step executes all of the lines of generated macro code as if it were a single PL/I statement. You can query variable values before and after execution, as if a single line of code has been executed. However, due to the nature of the PL/I macro language where a single macro can generate a small portion of an executable line, an entire line, or multiple lines, CodeWatch can not always provide that experience. In those cases you can use the techniques discussed in Debugging Internal Macro Code for a PL/I Program to facilitate your debugging.
By default, CodeWatch does not debug macro code within PL/I programs. When debugging a PL/I program with macro code, the debugger simply debugs through the lines that contain macro calls.
Consider this code sample, which contains multiple macro calls.
DEMO: PROC OPTIONS(MAIN);

  dcl x fixed bin(31) init(0);

%DCL $PGMSG ENTRY;
%$PGMSG: PROC (PGM) STATEMENT RETURNS (CHAR);
  DCL  PGM    CHAR;
  DCL  MSG    CHAR;
  DCL  SPACES CHAR;
  /*  Uncomment following 2 lines to recreate RPI 1087809 */

  SPACES = '
           ';

  msg =
  '  DO; '   || spaces ||
  '    /* Tracing Block for: ' || pgm ||  ' */'         || spaces ||
  '    put skip list("Pre Execution: ' || pgm || '");'  || spaces ||
  '    call ' || pgm || '(x);'                          || spaces ||
  '    put skip list("Complete: ' || pgm || '"); '      || spaces ||
  '    put skip; '                                      || spaces ||
  '  END; ';

   RETURN ( msg );
%END $PGMSG;

   x = x + 1; x = x + 2;

   $PGMSG(ADD10);
   $PGMSG(ADD20);

   x = x + 3;

   $PGMSG(SUBTRACT30);
   put skip data(x);

   $PGMSG(ADD10);

   put skip data(x);

   /**********************************/
   /*  Start of Internal Procedures  */
   /**********************************/

   /**********************/
     add10: proc(x);
   /**********************/
       dcl x fixed bin(31);
       put skip list('add10:  adding 10 to x');
       x = x + 10;
       put skip list('add10 (complete):  ' || x);

     end add10;

   /**********************/
     add20: proc(x);
   /**********************/
       dcl x fixed bin(31);
       put skip list('add20:  adding 20 to x');
       x = x + 20;
       put skip list('add20 (complete):  ' || x);

     end add20;

   /**********************/
     subtract30: proc(x);
   /**********************/
       dcl x fixed bin(31);
       put skip list('subtract30:  subtracting 30 from x');
       x = x - 30;
       put skip list('subtract30 (complete):  ' || x);

     end subtract30;


 END DEMO;
If during debugging, you are at the second statement in the line that precedes the two macro call lines:
x = x + 1; x = x + 2;
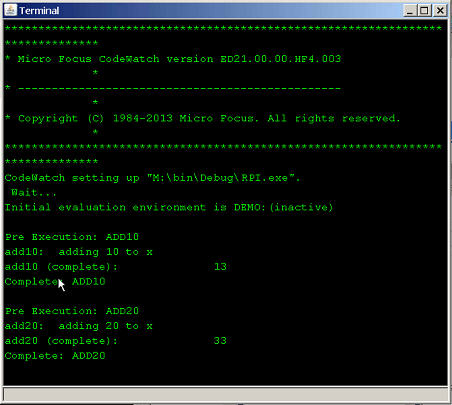
Pressing F10 to step debugs through the lines with the macro calls to the next statement in the code:
When CodeWatch debugs through macro code in your PL/I programs, the lines containing the macro calls execute without any debugging on the top level macro code. The output in the Terminal window shows values were derived and statements executed, indicating that the macro calls are executed without the code being debugged.
When program code containing macros also contains a CALL statement, you can debug the CALL statement code. To do this, place a breakpoint on the first line of code that executes for the statement. Press F10 to step to the breakpoint. Any variable values or other values appear in the CodeWatch window.
For example, the code sample above contains a call to (x): which is a call to subtract 30 from x. If you place a breakpoint at this line in the code sample:
put skip list('subtract30: subtracting 30 from x');
Pressing F10 to step into the line lets you see the variable values and other output, but does not let you view code at the top level of the macro. See Debugging Internal Macro Code for a PL/I Program for information on debugging inside of a macro.