Debugging the Batch Application
Starting the Bankdemo enterprise server
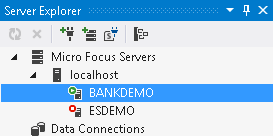
If the enterprise server is not yet started, you need to start it as follows:
- In Server Explorer, right-click BANKDEMO under Micro Focus Servers, then click Start.
- Right-click
Micro Focus Servers again, and then click
Refresh to see that the server has started.
Starting the debugger
The demonstration application includes around 60 programs and just eight of them, the ones which are included in the project, are debuggable. The default debugger in Enterprise Developer is the CICS Debugger. You need to select the JCL debugger to debug the batch Bankdemo application:
- In Solution Explorer, right-click the BankDemo project and click Properties.
- Click the Debug tab in the properties.
- Set Launch to JCL.
- Click to save your changes.
To start the debugger:
- Click
.
Visual Studio enters debug mode and opens a few new windows.
The application is now waiting for an event that will trigger the debugging.
Simple debugging
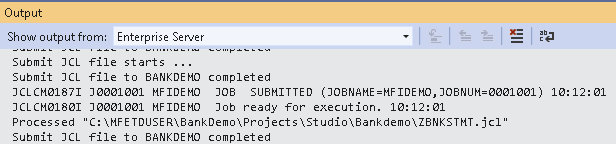
You can now look at some simple features inside the debugger. To submit the JCL job:
- In Solution Explorer, right-click
ZBNKSTMT.jcl and click
Submit JCL.
The debugger starts, and the IDE opens ZBNKEXT1.cbl for debugging, with the execution point set on the first line of Procedure Division.
- Check the Output window (click
View > Output to show the window, if it is hidden) and set
Show output from to
Enterprise Server to see the job has been submitted successfully.
Stepping through the code
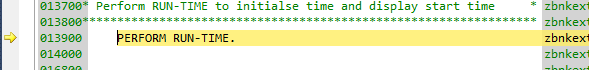
The highlighted line of code is the one the IDE will execute next.
- Press
F11 (Step Into) to execute the highlighted line.
The PERFORM statement executes and takes you to the line starting with IF TIMER-START.
- Press F11 slowly a few more times until you reach line 18000.
Using Run To Cursor
- Scroll down the file and position the cursor on a line further down the code.
- Right-click the line in the editor and click
Run To Cursor.
The application runs and executes the instructions till the line you selected.
Using the debug windows
There are a number of default windows which you can use while debugging the application such as:
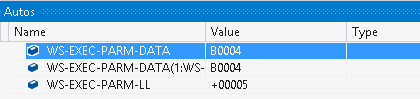
- Autos
- Shows the values of the data items on the current line you have stepped into.
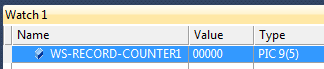
- Watch
- This window shows the values of data items you have added to the watch list. To set a watch on a data item:
- Scroll up to line 5900 in ZBNKEXT1.cbl.
- Right-click
WS-RECORD-COUNTER1 and click
Add Watch.
This adds the item to the Watch window so you can see how it changes as you step through the code.
There are some additional windows you can use as well. To open them:
- Click and select a window from the list.
- Open the windows for Breakpoints, Watchpoints, Program Breakpoints, a number of one to four Memory windows:
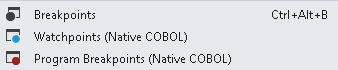
Note that the windows are stacked, with a tab running along the bottom of the window.
Looking at data values in debug mode
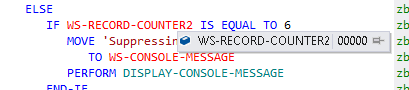
While debugging, you can preview the values of data items in the current context as follows:
- Open the ZBNKEXT1.cbl file and scroll down the code to line 24700.
- Hover over the
WS-RECORD-COUNTER2 data item.
This opens a pop-up with the value of the item in the current context:
- You can click
 to pin the pop-up to the editor window.
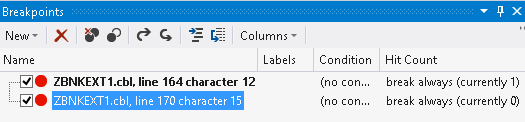
Setting a simple breakpoint
Open the Breakpoints window - currently, there are no breakpoints set in the program. You can set a simple breakpoint as follows:
- Scroll up the code to line 019100 of the ZBNKEXT1.cbl file.
- Double-click in the grey area to the left of this line or right-click the line and click
.
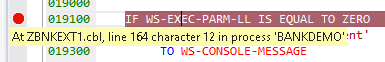
- Do the same for line 019700.
Note: You can enable and disable the breakpoints from the Breakpoints window.
- Click
F5 to run the code.
The execution of the code stops at the first breakpoint.
- Press
F5 to resume the execution.
You can see that ZBNKEXT1.cbl finishes and the debugger starts to debug the second program defined in the JCL.
This program executes to completion and the job completes.
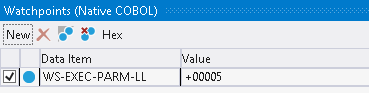
Setting a COBOL watchpoint
In native COBOL, you can set COBOL watchpoints on data items in the code, and watch the memory associated with that data item. You can add a COBOL watchpoint as follows:
- Scroll to line 9100 in the code of ZBNKEXT1.cbl file.
- Right-click
WS-EXEC-PARM-LL and click
Add COBOL Watchpoint.
This adds the item to the COBOL Watchpoints window.
- Notice how the value of this data item changes as you step through the code.
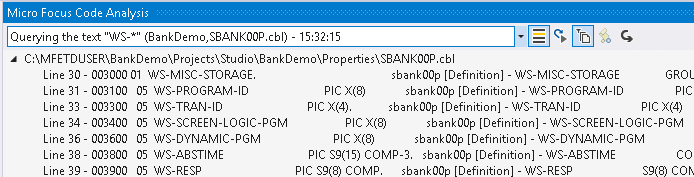
Running CSI queries
You can use the COBOL Source Information (CSI) functionality and its Quick Browse dialog to obtain information about your program when you are debugging it.
- Open the SBANK00P.cbl file in the editor.
- Click
 ,
Quick Browse, in the COBOL toolbar to start the CSI query control.
,
Quick Browse, in the COBOL toolbar to start the CSI query control.
See COBOL toolbar in the product help for more information.
- Enter a simple query such as
WS-*.
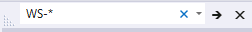
- Press
Enter to run the query.
The results are shown in the Micro Focus Code Analysis window:
Running COBOL reports
Enterprise Developer provides a few COBOL reports which you can run against your COBOL programs to help you understand and optimize them. For example, to run a report to identify any code that cannot be reached or executed, you need to run an unreferenced data report:
- With the
SBANK00P.cbl file still opened in the editor, click the down arrow next to
,
Quick Browse, in the COBOL toolbar and click
Unreferenced Data.
The IDE shows the results in the Micro Focus Code Analysis window:
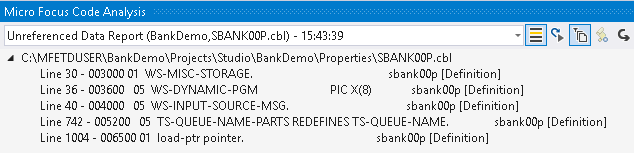
- Expand any of the lines in the report and double-click a line in the result to highlight the lines of code that include unreferenced data.
- Use the rest of the commands available from the down arrow next to
,
Quick Browse, in the COBOL toolbar to run any of the other available reports.
Stop debugging
Although the job has completed, the debugger is still waiting for the next event. To stop debugging:
- Click .