Analyzing CTF Trace
CTF in text format is a list of data events that might not make much sense. In the product installation directory, under %COBDIR%\etc\mftrace\annotations, there are XML files that explain what each data item should refer to. Each XML file is named after the component you trace in the CTF configuration file. In general, the format of an annotations file lists the arguments as indexes, and what value that index is corresponds to what that data item refers to. An example of this is below:
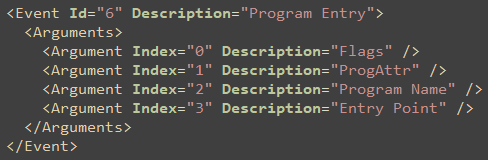
And the example line in the textfile CTF:

You would normally have a timestamp, a thread id and then the component name. After that is the 'event', which is 6 here, and the data after the colon is what corresponds to the indexes in the annotations file. So in this example, we know this is a program entry, with flags = 81, program attributes = 0, a program name of dfh0mq and the entry point is MqAccess.
This can sometimes still be difficult to decipher, so instead the preferred way is to generate CTF as binary format. When you format the binary CTF into textfile, or view it in CTF viewer, it uses these annotations file to annotate the entries so you do not need to do the above.