Breakpoints
A breakpoint is a location in your program’s code that you designate. When a breakpoint location is reached during program execution, control is returned to the debugger before the code at the breakpoint is executed.
Enabled breakpoints appear as red thumbtack icons in the Line Number pane of the debugger’s Code Editor window. Disabled breakpoints appear as yellow thumbtack icons.
Bookmarks that you set in your source code when you are working in the Code Editor automatically become breakpoints when you enter the debugger. These locations are marked with a standard bookmark icon, rather than the breakpoint thumbtack. Note that bookmarks are not included in the list of breakpoints displayed in the Debug > Breakpoints dialog box.
Breakpoints are most easily set and managed using the Debug toolbar buttons.
- To set or remove a breakpoint, use the Toggle Breakpoint push button.
- To temporarily disable a breakpoint, use the Disable Breakpoint push button.
- To remove all breakpoints, use the Clear All Breakpoints push button.
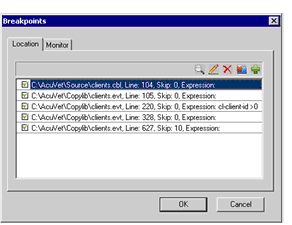
You can also set, modify, and delete breakpoints using the Breakpoints dialog box. To do this, select Breakpoints from the Debug menu.

The Breakpoints dialog displays a list of all the breakpoints set in your code, including the file name, line number, skip count, and expression associated with the breakpoint, as well as whether the breakpoint is currently enabled. With the buttons in the upper right corner of the tab, you can view the code associated with a breakpoint, modify or delete a breakpoint, delete all breakpoints, or add a new breakpoint. Selecting the New or Modify button opens the Breakpoint Details dialog. The Breakpoint Details dialog allows you to enter or modify the file name, line, skip count, and expression of the breakpoint. You can also enable or disable a breakpoint and set monitors on variables using this interface.
All of these functions are described in the following topics.