Run-Time Debugger
The run time, also referred to as runcbl, contains a built-in source-level debugger. This debugger runs in a window that overlays the screen so that the active program is not disturbed.
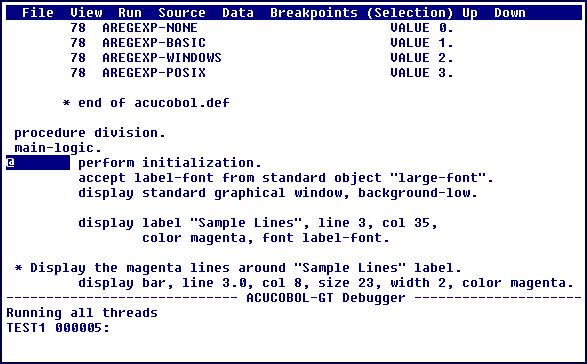
In all environments, the run-time debugger interface contains a menu bar and command window. To navigate through source code in character environments, use the Up and Down menu items. You can also use the arrow keys and Page Up and Page Down keys to move through the code.
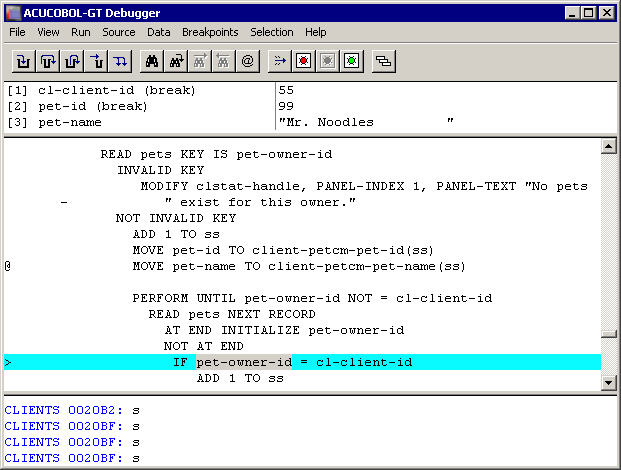
In Microsoft Windows environments, the debugger also contains a toolbar. When you perform full source debugging in Windows, a scroll bar appears to the right of the source, offering an easy way to scroll through the code.
You can run the debugger at any time, but in order to reference the program's symbols by name, or view the source code, you must have compiled the program with some special options.
The run-time debugger supports three modes of operation: source debugging, symbolic debugging, and low-level debugging.