Adding Report Controls
Report controls are elements that you can use to determine report layout and to format the data that will populate the report. Some of these controls affect the look and feel of the report, but are not directly related to report data (report line, box, and image). Other controls are concerned primarily with positioning and formatting data (report check box, date time, entry field, grid, occurs, radio button, and table). You choose the combination of controls that you need to create a useful and appropriate presentation for your data.
Report controls are listed in the Report Component Toolbox. If you are creating a graphical report, all of the controls in the Component Toolbox are enabled. If you are creating a character report, controls that include a graphical element appear disabled.
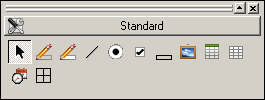
The Component Toolbox includes the following types of controls:
| Report Label | Generally holds information describing another report element. |
| Report Entry Field | A holder for data read into the report. |
| Report Line | Adds a horizontal or vertical line to a report. Can be used to delineate columns or underscore totals, for example. |
| Report Radio Button | Used to indicate the value of a piece of report data when only one of a group of options can be selected. |
| Report Check Box | Used with data that is either true or false. The box is checked when the corresponding data item has a value of 1 and unchecked when the item value is 0. |
| Report Box | Draws a box, similar to the screen frame, around a report section or element. Does not include the grouping component of a frame control. |
| Report Image | Used to add one or more .bmp or .jpg images to a report. |
| Report Grid | Used to provide a standard heading/column layout to data in your report. Can be used to add multiple records or database table rows to a single report detail section. |
| Report Occurs | Uses the OCCURS clause in a data table or array to create a line and column table layout for the data in the report. |
| Report Data Time | Offers several formats for adding date or time information to the report. |
| Report Table | Provides a method for structuring the output of a line of data. The table can have a vertical or horizontal orientation, and connects a header to a row of report data. The data can include literals, variables, and images. |