Session Info Panel
Fortify WebInspect lists each session created during a scan in the navigation pane using either the Site view or Sequence view. Select a session and then click one of the options in the Session Info panel to display related information about that session.
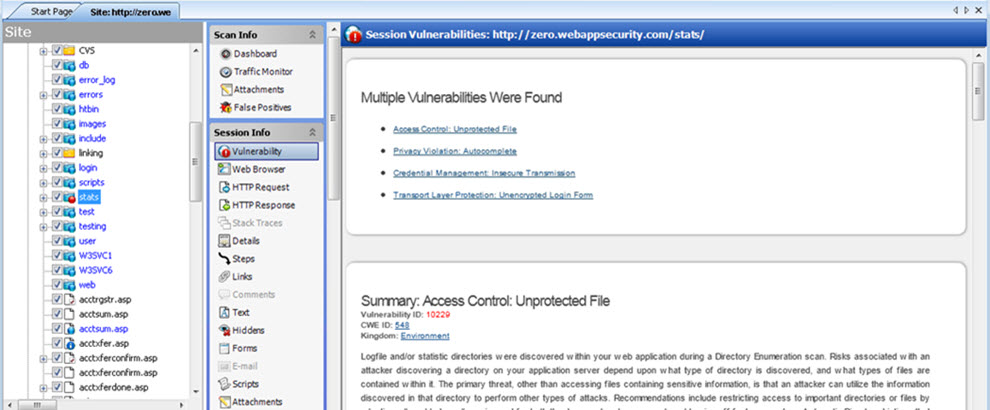
In the following example scan, Fortify WebInspect sent the HTTP request GET /stats/stats.html HTTP/1.1.
To see the vulnerability:
-
Select Stats.html in the navigation pane.
-
In the Session Info panel, click Vulnerability.
Options Available
The following table lists the options available in the Session Info panel. Some options appear only for specific scans (Basic Scan or Web Service Scan). Also, options are enabled only if they are relevant to the selected session; for example, the Forms selection is not available if the session does not contain a form.
| Option | Description |
|---|---|
|
Vulnerability |
Displays the vulnerability information for the session selected in the navigation pane. |
|
Web Browser1 |
Displays the server's response as rendered by a Web browser for the session selected in the navigation pane. |
|
HTTP Request |
Displays the raw HTTP request sent by Fortify WebInspect to the server hosting the site you are scanning. |
|
HTTP Response |
Displays the server's raw HTTP response to Fortify WebInspect's request. If the response contains one or more attack signatures (indicating that a vulnerability has been discovered) you can tab from one attack signature to the next by clicking these buttons:
If you select a Flash (.swf) file, Fortify WebInspect displays HTML instead of binary data. This allows Fortify WebInspect to display links in a readable format. |
| Stack Traces |
This feature is designed to support Fortify WebInspect Agent when it is installed and running on the target server. For certain checks (such as SQL injection, command execution, and cross-site scripting), Fortify WebInspect Agent intercepts Fortify WebInspect HTTP requests and conducts runtime analysis on the target module. If this analysis confirms that a vulnerability exists, Fortify WebInspect Agent appends the stack trace to the HTTP response. Developers can analyze this stack trace to investigate areas that requires remediation. |
|
Details1 |
Lists request and response details, such as the size of the response and the request method. Note that the Response section contains two entries for content type: returned and detected. The Returned Content Type indicates the media type specified in the Content-Type entity-header field of the HTTP response. Detected Content Type indicates the actual content-type as determined by Fortify WebInspect. |
| Steps1 |
Displays the route taken by Fortify WebInspect to arrive at the session selected in the navigation pane or the URL selected in the summary pane. Beginning with the parent session (at the top of the list), the sequence reveals the subsequent URLs visited and provides details about the scan methodology. |
|
Links1 |
This option lists (under Linked From) all resources at the target site that contain links to the selected resource. The links may be rendered by HTML tags, scripts, or HTML forms. It also lists (under Linked To) all resources that are referenced by links within the HTTP response for the selected session. |
|
Comments1 |
Displays all comments (in HTML) embedded in the HTTP response. |
|
Text1 |
Displays all text contained in the HTTP response for the session selected in the navigation pane. |
|
Hiddens1 |
Displays the name attribute of each input element whose control type is "hidden." |
|
Forms1 |
Displays the HTML interpreted by the browser to render forms. |
|
E-mail1 |
Displays all e-mail addresses included in the response. |
|
Scripts1 |
Displays all client-side scripts embedded in the server's response. |
|
Attachments |
Displays all notes, flags, and screenshots associated with the selected object. To create an attachment, you can either:
Fortify WebInspect automatically adds a note to the session information whenever you send a defect to Micro Focus Application Lifecycle Management (ALM). |
|
Attack Info1 |
Displays the attack sequence number, URL, name of the audit engine used, and the result of the vulnerability test. Attack information is usually associated with the session in which the attack was created and not with the session in which it was detected. If attack information does not appear for a selected vulnerable session, select the parent session and then click Attack Info. |
|
XML Request2 |
Displays the SOAP envelope embedded in the request (available when selecting an operation during a Web Service Scan). |
|
XML Response2 |
Displays the SOAP envelope embedded in the response (available when selecting an operation during a Web Service Scan). |
| Web Service Request2 | Displays the web service schema and values embedded in the request (available when selecting an operation during a Web Service Scan). |
| Web Service Response2 | Displays the web service schema and values embedded in the response (available when selecting an operation during a Web Service Scan). |

1 Basic or Guided Scan only
2 Web Service Scan only
Most options provide a Search feature at the top of the information pane, allowing you to locate the text you specify. To conduct a search using regular expressions, select the Regex button before clicking Find.
Tip: If you follow a link when viewing the vulnerability information, click the highlighted session in the navigation pane to return.
See Also