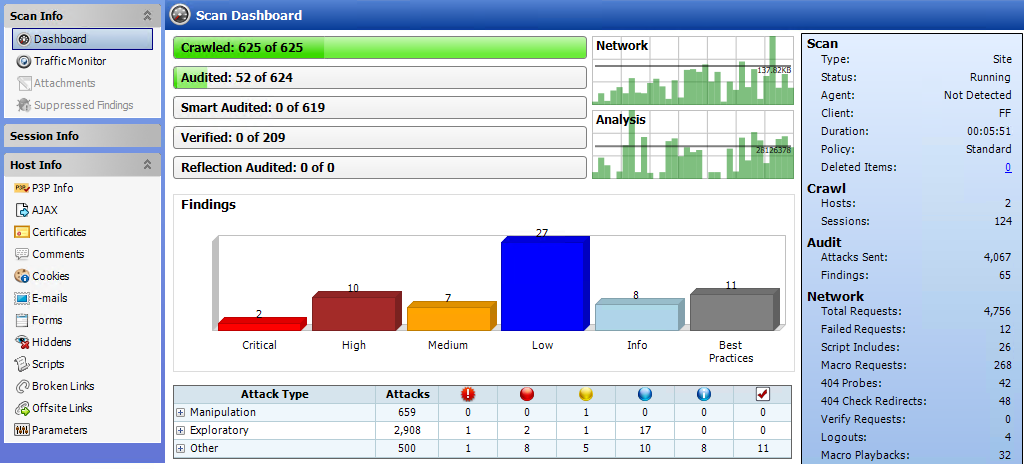
Dashboard
The Dashboard selection displays a real-time summary of the scan results and a graphic representation of the scan progress.
The following image displays the Scan Dashboard with a scan in progress.
Progress bars
Each bar represents the progress being made through that scanning phase.
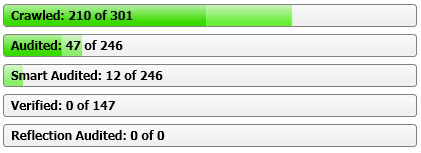
Progress bar descriptions
The following table describes the progress bars.
| Progress Bar | Description |
|---|---|
| Crawled |
Number of sessions crawled / total number of sessions to crawl. |
| Audited |
Number of sessions audited / total number of sessions to audit. The total number includes all checks except those pertaining to server type, which are handled by smart audit. |
| Smart Audited |
Number of sessions audited using smart audit / total number of sessions for smart audit. For smart audit, OpenText DAST detects the type of server on which the Web application is hosted. OpenText DAST runs checks that are specific to the server type and avoids checks that are not valid for the server type. |
| Verified |
Number of persistent XSS vulnerable sessions verified / total number of persistent XSS vulnerable sessions to verify. When persistent XSS auditing is enabled, OpenText DAST sends a second request to all vulnerable sessions and examines all responses for probes that OpenText DAST previously made. When probes are located, OpenText DAST will record links between those pages internally. |
| Reflection Audited |
Number of persistent XSS vulnerable linked sessions audited / total number of persistent XSS vulnerable linked sessions to audit. When persistent XSS auditing is enabled, this represents the work required for auditing the linked sessions found in the verification step for persistent XSS. |
Progress bar colors
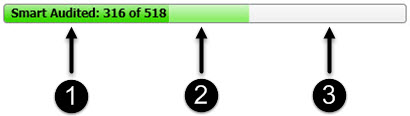
-
Dark green indicates sessions that have been processed.
-
Light green indicates excluded, aborted, or rejected sessions (sessions that were considered for processing, but were skipped due to settings or other reasons).
-
Light gray indicates the unprocessed sessions.
Activity meters
OpenText DAST polls information about the activity occurring in the scan and displays the data in activity meters. The data presents a real-time snapshot of the scan activity. This information can help you to determine whether the scan is stalled or actively running.
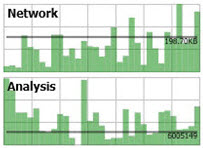
Activity meter descriptions
The following table describes the activity meters.
| Meter | Description |
|---|---|
| Network |
The amount of data being sent and received by OpenText DAST. The chart shows this data as B, KB, or MB sent/received over the last one second. |
| Analysis |
The amount of work being done per second by OpenText DAST in processing all threads. |
Findings graphics
The following table describes the Findings bar graph and grid.
| Graphic | Description |
|---|---|
| Findings Graph |
Total number of issues identified for the scan per severity level. |
| Attack Stats Grid | Number of attacks made and issues found, categorized by attack type and audit engine. |
Statistics panel - Scan
The following table describes the Scan section of the statistics panel.
| Item | Description |
|---|---|
| Type |
Type of scan: Site, Service, or Site Retest. |
| Scan Status |
Status: Running, Paused, Interrupted, or Complete. |
| Agent |
Refers to the OpenText DAST Agent and states either Detected or Not Detected. For certain checks (such as SQL injection, command execution, and cross-site scripting), OpenText DAST Agent intercepts OpenText DAST HTTP requests and conducts runtime analysis on the target module. If this analysis confirms that a vulnerability exists, OpenText DAST Agent appends the stack trace to the HTTP response. Developers can analyze this stack trace to investigate areas that require remediation. |
| Client |
The rendering engine specified for the scan. Options are:
|
| Duration |
Length of time scan has been running (can be incorrect if the scan terminates abnormally). |
| Policy |
Name of the policy used for the scan. If the scan used multiple policies, the number of policies selected is shown as a hyperlink. Click the link to view the selected policies. |
| Deleted Items |
The number of sessions and vulnerabilities removed by the user from the scan. To remove a session, right-click a session in the Navigation pane and select Remove Location from the shortcut menu. For more information, see Navigation pane. To remove a vulnerability, right-click a vulnerability in the Summary pane and select Ignore Vulnerability from the shortcut menu. For more information, see Summary pane. To restore sessions or vulnerabilities that have been deleted:
|
Statistics panel - Crawl
The following table describes the Crawl section of the statistics panel.
| Item | Description |
|---|---|
| Hosts |
Number of hosts included in the scan. |
| Sessions |
Total number of sessions (excluding AJAX requests, script and script frame includes, and WSDL includes). |
Statistics panel - Audit
The following table describes the Audit section of the statistics panel.
| Item | Description |
|---|---|
| Attacks Sent |
Total number of attacks sent. |
| Issues |
Total number of issues found (all vulnerabilities, as well as best practices). |
Statistics panel - Network
The following table describes the Network section of the statistics panel.
| Item | Description |
|---|---|
| Total Requests |
Total number of requests made. |
|
Failed Requests |
Total number of failed requests. |
| Script Includes |
Total number of script includes. |
| Macro Requests |
Total number of requests made as part of macro execution. |
|
404 Probes |
Number of file not found probes made to determine file not found status. |
|
404 Check Redirects |
Number of times a 404 probe resulted in a redirect. |
|
Verify Requests |
Requests made for detection of stored parameters. |
| Logouts |
Number of times logout was detected and login macro executed. |
|
Macro Playbacks |
Number of times macros have been executed. |
| AJAX Requests |
Total number of AJAX requests made. |
| Script Events |
Total number of script events processed. |
| Kilobytes Sent |
Total number of kilobytes sent. |
| Kilobytes Received |
Total number of kilobytes received. |
See also