Tour of the UI
These are the main sections of the Performance Explorer user interface:
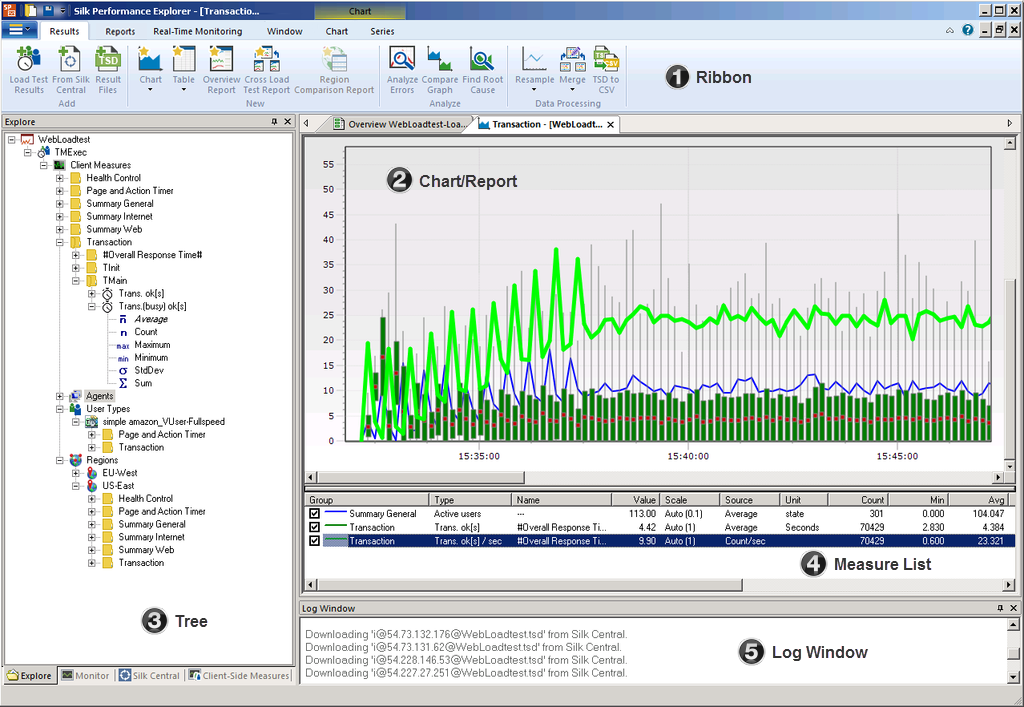
(1) Ribbon
The ribbon in Performance Explorer contains 4 permanent tabs and 2 contextual tabs. While the permanent tabs are always visible, the contextual tabs are only visible if a chart or a report is open and active. These are the permanent tabs:
- Results: This tab contains all commands around displaying and analyzing results.
- Reports: This tab contains all commands around creating and working with reports.
- Real-Time Monitoring: This tab contains all commands around the real-time monitoring functionality of Performance Explorer.
- Window: This tab contains several window commands, like tiling or cascading windows, resetting the layout, and so on.
These are the contextual tabs:
- Chart: This tab is visible when a chart is active. It contains all commands that control the appearance of charts and graphs.
- Series: This tab is visible when a chart is active. It contains all commands that control the appearance of series.
(2) Chart/Report
In this area the charts and reports are displayed. You can easily drag measures from the tree onto a chart. By using the commands in the contextual tabs, you can adjust the appearance of charts, graphs, and reports. For example: In a chart, you can change colors, line width, line styles, enable scaling, display markers, null values, measure bounds, and so on.
(3) Tree
The tree area consists of the following four trees (the tree tabs display on the bottom of the tree area): The Explore tree shows the measures of a load test or single .tsd file. The Monitor tree shows the measures of the system that is to be monitored. The Silk Central tree shows the measures of a load test that is managed and invoked through Silk Central. The Client-Side-Measures tree shows client-side measures.
You can drag measures from the tree onto a chart. You can double-click the white-space in the tree to add a load test or a system.
(4) Measure List
The measure list is visible when a chart is open and active. It lists all measure that display in the chart. You can click the check boxes to turn the measures in the chart on and off. The list also supports multi-select functionality, so switching on and off several or all measures concurrently is possible.
(5) Log Window
The log window lists all events that occur during performance monitoring, including errors and query states. You can switch the log window on and off in the Window tab and you can right-click in the log window and copy or clear the log.