Overview Report
The overview report comprises the following sections:
-
General information
- Summary tables
- User types
- Custom charts
- Custom tables
- Detailed charts
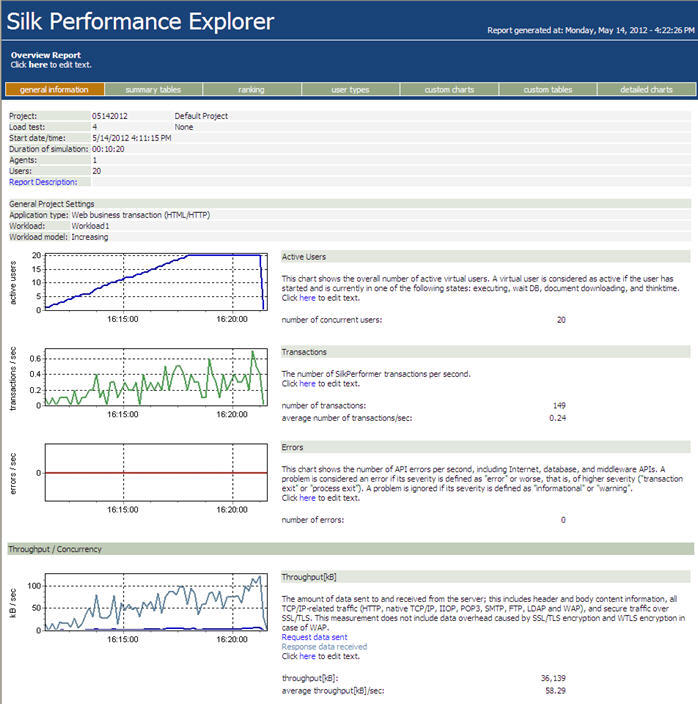
General information
The general information section includes administrative information in tabular form as well as important load test results in a graphical form.
Administrative information includes the project name, a description of the project, the load test number, a description of the load test, the date of the load test, the duration of the load test, the number of used agent computers, and the number of virtual users that were running.
The charts display the number of active virtual users, response time measurements for transactions, and the number of errors that occur over time. Transaction response times are provided for successfully executed transactions, for failed transactions, and for cancelled transactions.
Additional charts display summary measurements related to the type of load testing project. For example, in the case of Web application testing, response time measurements for Web pages are presented in a graph.
Summary tables
This section contains summary measurements in tabular form, that is, aggregate measurements for all virtual users. The first table provides general information, such as the number of transactions that were executed and the number of errors that occurred. All the following tables provide summary information relevant to the type of application that was tested.
User types
For each user group, this section provides detailed measurements in tabular form. The measurements include transaction response times, individual timers, counters, and response time and throughput measurements related to the type of application that was tested (Web, database, CORBA, or TUXEDO). In addition, errors and warnings for all user groups are listed.
Custom charts
This section contains graphs that you have added manually. You can add charts to and remove charts from this section at any time. You can save your changes as a template to be displayed for every summary report.
Custom tables
This section contains tables that you have added manually. You can add tables to and remove tables from this section at any time. You can save your changes as a template to be displayed for every summary report.
Detailed charts
This section provides enlarged versions of the charts included in the report. Click a reduced version of a chart to jump to the enlarged version, and vice versa.