Overview of Debugging in Visual Studio Code
Debugging in Visual Studio Code requires that you create a launch configuration with the settings which the debugger requires to enable it to debug your COBOL or PL/I code. The following instructions demonstrate how to debug native COBOL or PL/I code with the default launch configuration:
- Open the folder that contains your sources in Visual Studio Code.
- Ensure that the sources are compiled.
- Click (Run > Start Debugging).
This shows the Task Picker with the available debugging tasks:
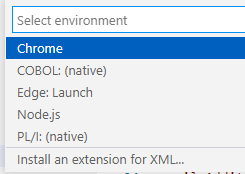
- Select
the task required for your code - either
COBOL (native): (native) or
PL/I: (native) from the drop-down list. This is the default task provided with the
Rocket Enterprise extension for debugging native COBOLor PL/I applications, respectively.
This creates a launch.json file in a .vscode subfolder in the folder that holds your sources. By default, the launch.json contains two configurations - one for debugging a standalone application, and one for attaching the debugger to a running process. For COBOL these are:
    "configurations": [
        {
            "type": "cobol",
            "request": "launch",
            "name": "COBOL (native): Launch",
            "program": "${workspaceFolder}/<insert-program-name-here>",
            "cwd": "${workspaceFolder}",
            "stopOnEntry": true
        },
        {
            "type": "cobol",
            "request": "attach",
            "name": "COBOL (native): Attach to process",
            "processId": "${command:pickProcess}"
        }
    ]
}
For PL/I, the configurations are:
    "configurations": [
        {
            "type": "pli",
            "request": "launch",
            "name": "PL/I: Launch",
            "program": "${workspaceFolder}/<insert-program-name-here>",
            "cwd": "${workspaceFolder}",
            "stopOnEntry": true
        },
        {
            "type": "pli",
            "request": "attach",
            "name": "PL/I: Attach to process",
            "processId": "${command:pickProcess}"
        }
    ]
You can add more configurations to this file as required.
- In the Activity bar, click
 to open the Run panel.
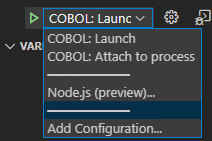
The two default launch configurations are listed in the Configuration drop-down within the Run panel as follow - for COBOL:
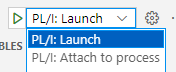
Or, for PL/I code:
- Select the launch configuration,
COBOL (native): Launch or
PL/I: Launch, and click
 (Start Debugging).
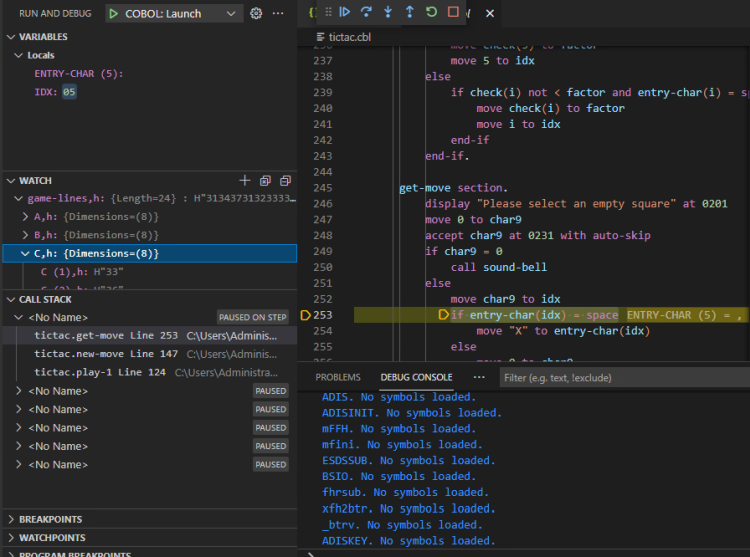
- Use the commands in the Debug widget to step through the code.
- Use the available views to watch how variables change.
- As you step through the code, the values of variables on the current line are shown inline in the editor, at the end of the
line:
You can control whether to display the inline values with the Microsoft Debug: Inline Values setting of Visual Studio Code.
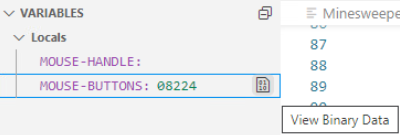
- In the
VARIABLES panel, click the
View Binary Data icon on a row for a variable.
This opens a Memory window that enables you to view and edit data in the memory associated with the selected item.