Open topic with navigation
Refining and Charting a Search from Field Summary
When you click a field in the Field Summary, a dialog box labeled <fieldname><number of values> displays information about the field. From here, you can drill down to see more details and create a chart of the search results.
To view field details from field summary:
- Run a search and drill down to the data you are interested in, as described in Field Summary Drill Down.
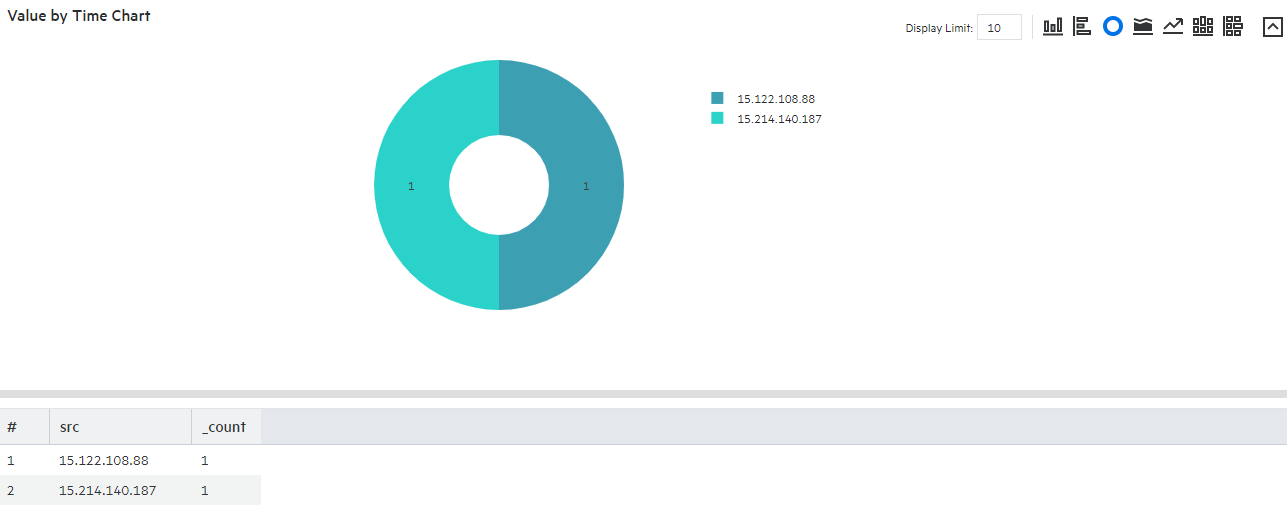
- To create a chart of the search results, click one of the Chart on values, such as Values by time or Top values.
- The results display in a Result Chart and a Result Table.
- In the Result Chart, click Chart Settings to adjust the chart.
-
Enter a useful Chart Title.
- Select the Chart Type best suited to your data.
- Set the Display Limit. The highest valid value is 100.
-
In the Result Table, you can use navigation buttons to move forward and backward through list of results, and refresh the search.
To create a PDF or CSV file containing the search results, click Export Results  . For more information, see Exporting Search Results.