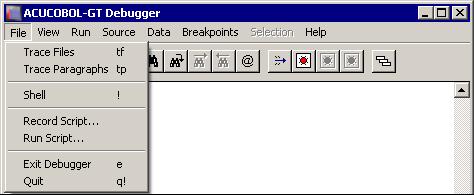
File Menu
The File menu contains commands relating to the overall operation of the debugger.
| Menu Option | Description |
|---|---|
| Trace Files | Toggles file tracing on or off.
A file trace is a listing of all file operations performed at runtime. Trace output can be tailored with the TRACE_STYLE configuration variable.>. Trace output is sent to the same place that error output is sent. So, to prevent the trace from overwriting your application's screen, be sure to use the runtime's -e command-line option (followed by a file name) to direct error output to a file. See the runtime configuration variable MAX_ERROR_LINES in Appendix H to limit the size of the error file. Some file systems can print extra information if a higher level of tracing is enabled. This extra information is mostly useful to the Technical Support department at Acucorp, and they may ask you to execute a tf n for some integer n. File trace example: runcbl -de trace.fil program1 Make sure that the error file you designate (trace.fil in the example above) does not exist in the current directory. If it does, it will be emptied. The keyboard form of this command is TF [#]. |
| **Trace Paragraphs | Toggles paragraph tracing on or off.
Paragraph tracing is a listing of all paragraphs and sections entered at runtime. A paragraph trace is sent to the same place that error output is sent. So, to prevent the trace from overwriting your application's screen, be sure to use the runtime's -e command-line option (followed by a file name) to direct error output to a file. The keyboard form of this command is TP. |
| Shell | Pulls up the operating system's command processor, allowing you to enter commands. Shell is not supported for programs running
in thin client mode. Attempts to use the Shell command with programs running in thin client mode will result in the error
message:
Unable to start shell in thin-client mode.
Note: Under the default Windows setup, the command processor will run as a full screen application.
The keyboard form of this command is !. |
| Record Script | Turns on a recorder that saves all of your keyboard input and menu selections to a file of your choice. Debugger commands
and input to the program being debugged are both saved.
Play back the recording with the Run Script command. See also the description of the W$KEYBUF routine in Appendix I. |
| Stop Recorder | When the recorder is running, the
Record Script menu option is replaced by a
Stop Recorder option. Use this to end your recording. If you do not end your recording manually, the script information is saved when the
debugger closes.
While the recorder is active, you will not be able to use the mouse for anything except selecting menu items. Mouse actions are very position-dependent and are often difficult to replay. The recorder can save up to 4096 characters of information. Normal keystrokes use one character. Special keys such as function keys and menu selections typically use up to four characters. The keyboard form of this command is >script-file. The runtime does not process the filename. To turn off the recorder, use > by itself. |
| Run Script | Runs a debugger script file. Control returns to the keyboard when the script is finished.
The keyboard form of this command is < script-file. |
| Exit Debugger | Turns off the debugger but continues execution of your program.
The keyboard form of this command is E. |
| Quit | Halts your application and exits the debugger.
The keyboard form of this command is Q!. |