Viewing high-level summary metrics (graphical representation) for an application version
You can view a graphical representation of high-level summary metrics for individual application versions from the CHART page.
To view summary metrics for application versions from the CHART page:
On the Dashboard view, click CHART.
Application Security opens to the REVIEWED tab.
In the list of application versions, point to a colored bar for an application version to see the summary findings for the version.
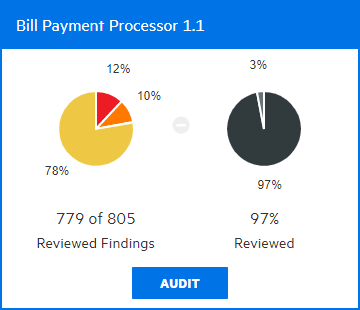
In the example shown here, the pie chart on the left shows the security ratings for the 97% of findings (779 of 805) that have been audited to date for this application version. The chart on the right shows the percentage of findings audited (97) and the percentage of the total that has yet to be audited (3).
To go to the AUDIT page for the application version, click AUDIT.