Correlating Results
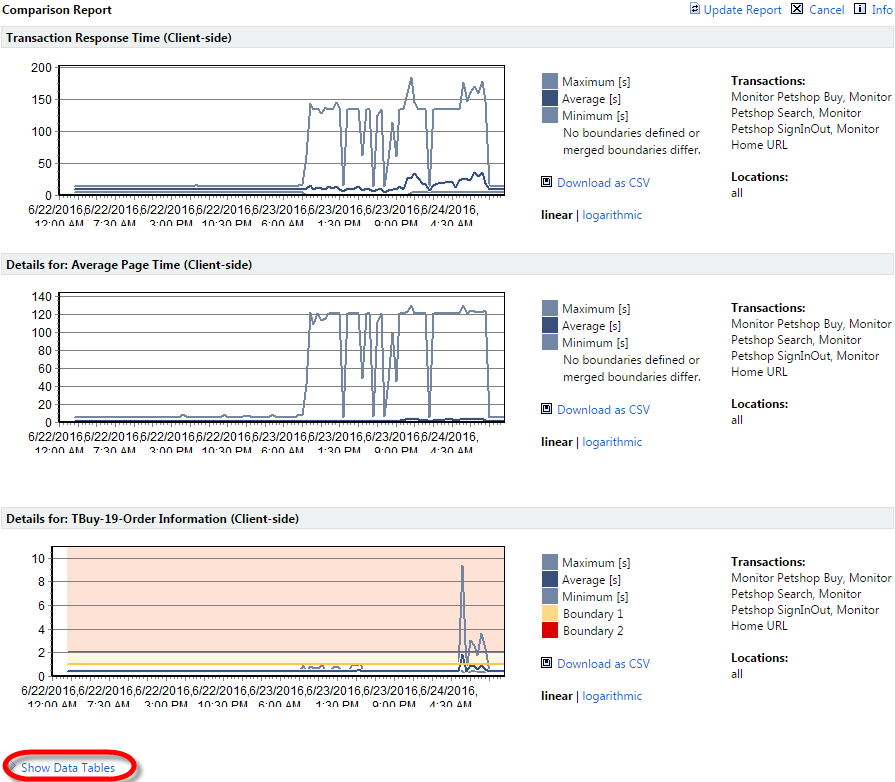
This generates a report with all performance details for the selected measurements on a single page and enables visual correlation of metrics. By default, data tables are hidden, so that more charts can be shown on each page. Click Show data tables to display data tables beneath the charts. See Performance Detail Charts for more information about what is available on this page.
Upon returning to the Client Health report, you can select additional measures and click Add to Comparison Report to add the new measures to the comparison report.
Automatic result correlation
Because time is a critical factor when a production system is exposed to problems, Performance Manager offers options for automatically correlating results and streamlining root-cause analysis. This method involves correlating all results that experience a hit of the upper bound during a given time period (Show Boundary #2 Violations).
Correlation based on boundary #2 violations
The automatic correlation offered by Performance Manager is correlation based on boundary #2 violations. This feature facilitates root cause analysis by generating a comparison report that includes only those metrics that hit boundary 2 during the selected time frame. This is an easy means of gaining insight into the possible causes and related symptoms of performance issues.
Boundary #2 correlation reports can become unwieldy when too many metrics hit boundary 2. When no timers or counters have boundary 2 violations during the selected time frame, the report does not display; an informational dialog is displayed instead.