Performance
The Performance section of the project overview report is divided into the following areas:
- Transaction response time
- Page times
- Custom timers
- Custom counters
- Performance
- Average (Avg [s])
- Minimum (Min [s])
- Maximum (Max [s])
- Standard deviation (Std. Dev): An indication as to the stability of a measurement. If values are more or less always the same, the Std. Dev value will be relatively small. A large Std. Dev value indicates that a measure is quite variable.
- Histogram (see Histograms)
- Transaction response time: Shows the average transaction response times for all selected transactions (see Setting up Monitors).
- Page times: Total page download time. To view detailed page statistics, go to the page detail report by clicking the page name.
- Custom Timers: Custom timers are created by the script functions MeasureStart() and MeasureStop() and can be used to measure individual timings of interest.
- Custom Counters: Custom counters are created by the script function MeasureIncFloat and can be used to measure individual components of interest (for example, custom counters are used in resource monitors to measure such things as CPU usage, memory usage, and throughput related measures).
The Count column indicates how often a timer or counter was measured during a given time frame.
Boundaries
Performance Manager's Boundary Editor is the recommended approach for editing bounds in Silk Performer scripts. See Configuring Static Boundaries for Performance Values for details.
Performance rates are calculated by comparing measured values to boundary values. Outside of specified boundaries, performance is considered to be either "good" or "bad." Boundaries can be defined explicitly using Silk Performer's MeasureSetBound function or automatically by Performance Manager. See Adding Monitors for details.
If you defined boundaries explicitly, using Silk Performer's MeasureSetBound function, you should select Performance Rate Calculation based on bounds defined in the script when creating the monitor.
If you use automatically adjusted boundaries, or if you changed the boundaries in the script, the actual values of the boundary is displayed in parenthesis, the percentage indicates how many measurements were below or above the boundary whatever it was in the past. You can see the changes of the boundaries in the detail chart of the measurement.
Rather than using a percentile algorithm to establish performance health, raw data is assessed against two specific boundaries that allow performance to be established using a metric that is common to availability and accuracy ratings.
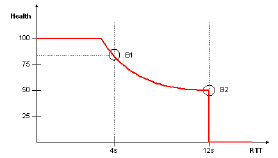
Based on the health function shown above, the first boundary (B1) is considered to be the ideal value. Deviations from this ideal are not critical, but they are reflected in health values. This is particularly important when there is a pattern of performance degradation. The emphasis of these deviations is supported by the exponential behavior of the function. The second boundary (B2) marks severe behavior, and so the health rating drops to zero.
The ability to define boundaries allows users to implement custom rating systems that are meaningful. Boundary values are typically obtained from the baselines of previous load tests. Examples include "70.00% < 8.00" (boundary 1) and "100.00% < 16.00" (boundary 2). Such boundaries indicate that 70% of the transactions are completed in under 8 seconds and 100% of the transactions are completed in under 16 seconds.
Histograms
- The left sides of histograms indicate the percentage of measures below both bounds (good performance) in green.
- The middle indicates the percentage of measures higher than bound 1 and below bound 2 (performance warning level) in yellow.
- The right side indicates the percentage of measures above both bounds (poor performance) in red.